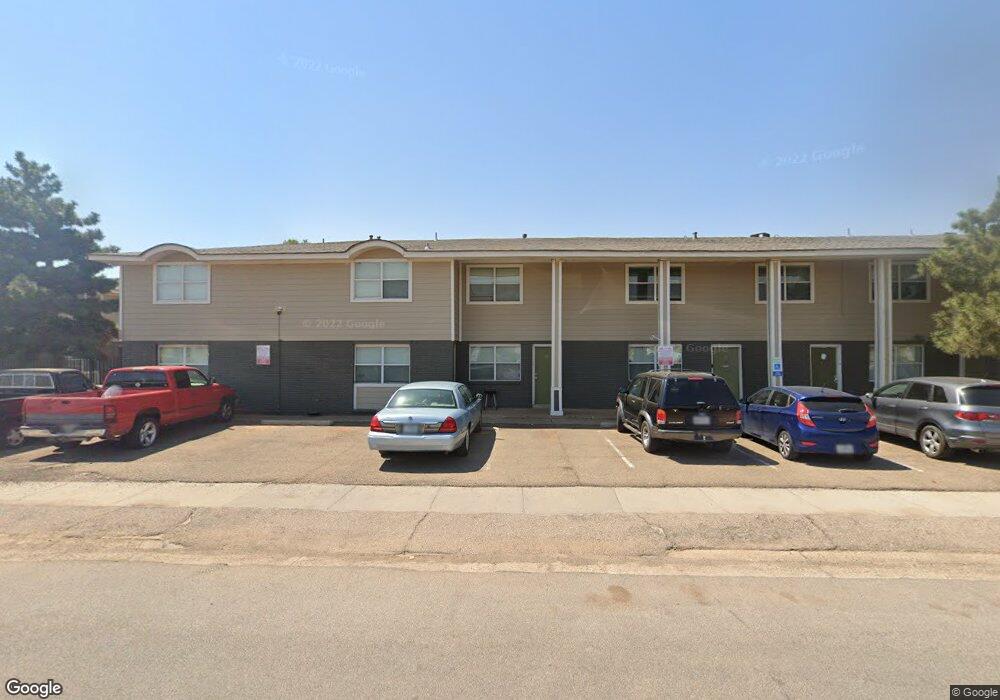
4345 28th St Lubbock, TX 79410
Maxey Park Neighborhood
3
Beds
1
Bath
900
Sq Ft
--
Built
About This Home
This home is located at 4345 28th St, Lubbock, TX 79410. 4345 28th St is a home located in Lubbock County with nearby schools including Overton Elementary School, Mackenzie Middle School, and Coronado High School.
Ownership History
Date
Name
Owned For
Owner Type
Purchase Details
Closed on
Jun 28, 2022
Sold by
Ventura Flats Holding Company Llc
Bought by
Red Page Ventures Ii Llc
Purchase Details
Closed on
Sep 30, 2014
Sold by
Asken Properties Lubbock Square Lp
Bought by
Ventura Flats Holding Company Llc and Dennis Katz Llc
Purchase Details
Closed on
Dec 7, 2006
Sold by
Gin Calvin C and Gin Sheung Y
Bought by
Asken Properties Lubbock Square Lp
Purchase Details
Closed on
Mar 6, 2003
Sold by
Liman Enterprises L L P
Bought by
Ventura Flats Holding Company Llc
Create a Home Valuation Report for This Property
The Home Valuation Report is an in-depth analysis detailing your home's value as well as a comparison with similar homes in the area
Home Values in the Area
Average Home Value in this Area
Purchase History
| Date | Buyer | Sale Price | Title Company |
|---|---|---|---|
| Red Page Ventures Ii Llc | -- | Hub City Title | |
| Ventura Flats Holding Company Llc | -- | Western Title | |
| Asken Properties Lubbock Square Lp | -- | Western Title Company | |
| Ventura Flats Holding Company Llc | -- | -- |
Source: Public Records
Tax History
| Year | Tax Paid | Tax Assessment Tax Assessment Total Assessment is a certain percentage of the fair market value that is determined by local assessors to be the total taxable value of land and additions on the property. | Land | Improvement |
|---|---|---|---|---|
| 2025 | $46,759 | $2,575,000 | $139,050 | $2,435,950 |
| 2024 | $468 | $2,575,000 | $139,050 | $2,435,950 |
| 2023 | $46,471 | $2,500,000 | $139,050 | $2,360,950 |
| 2022 | $42,511 | $2,100,000 | $139,050 | $1,960,950 |
| 2021 | $40,155 | $1,875,000 | $139,050 | $1,735,950 |
| 2020 | $38,316 | $1,762,095 | $139,050 | $1,623,045 |
| 2019 | $39,708 | $1,768,784 | $139,050 | $1,629,734 |
| 2018 | $39,149 | $1,741,629 | $139,050 | $1,602,579 |
| 2017 | $30,217 | $1,342,550 | $139,050 | $1,203,500 |
| 2016 | $29,260 | $1,300,000 | $139,050 | $1,160,950 |
| 2015 | $23,792 | $1,425,229 | $139,050 | $1,286,179 |
| 2014 | $23,792 | $1,070,000 | $139,050 | $930,950 |
Source: Public Records
Map
Nearby Homes
Your Personal Tour Guide
Ask me questions while you tour the home.