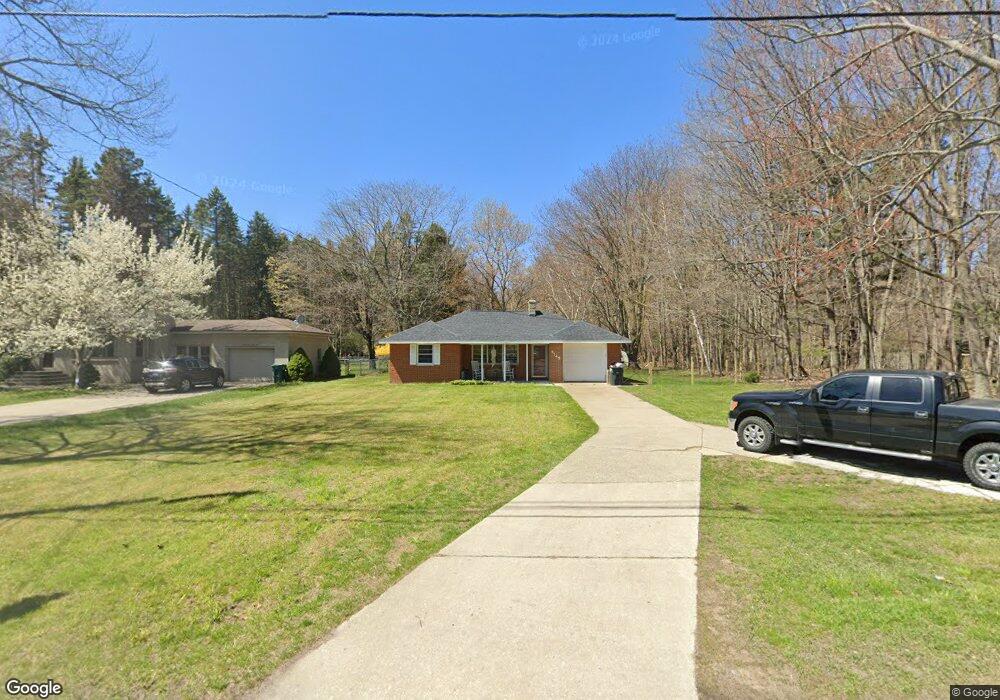
4345 Lake Harbor Rd Norton Shores, MI 49441
Estimated Value: $279,694 - $323,000
2
Beds
2
Baths
1,238
Sq Ft
$240/Sq Ft
Est. Value
About This Home
This home is located at 4345 Lake Harbor Rd, Norton Shores, MI 49441 and is currently estimated at $297,174, approximately $240 per square foot. 4345 Lake Harbor Rd is a home located in Muskegon County with nearby schools including Mona Shores High School, West Shore Lutheran School, and St. Francis De Sales Elementary School.
Ownership History
Date
Name
Owned For
Owner Type
Purchase Details
Closed on
Sep 17, 2012
Sold by
Munson Barbara
Bought by
Munson Joseph L and Munson Brian E
Current Estimated Value
Purchase Details
Closed on
Oct 18, 2010
Sold by
Munson Barbara
Bought by
Munson Barbara
Purchase Details
Closed on
Sep 30, 2010
Sold by
Munson Barbara
Bought by
Munson Barbara and Munson Laurence
Purchase Details
Closed on
Oct 28, 2004
Sold by
Sirotko Michael J and Sirotko Angela L
Bought by
Munson Larry
Home Financials for this Owner
Home Financials are based on the most recent Mortgage that was taken out on this home.
Original Mortgage
$50,000
Outstanding Balance
$25,002
Interest Rate
5.81%
Mortgage Type
New Conventional
Estimated Equity
$272,173
Purchase Details
Closed on
Oct 13, 2004
Sold by
Sirotko Phyllis A
Bought by
Sirotko Michael J
Home Financials for this Owner
Home Financials are based on the most recent Mortgage that was taken out on this home.
Original Mortgage
$50,000
Outstanding Balance
$25,002
Interest Rate
5.81%
Mortgage Type
New Conventional
Estimated Equity
$272,173
Create a Home Valuation Report for This Property
The Home Valuation Report is an in-depth analysis detailing your home's value as well as a comparison with similar homes in the area
Home Values in the Area
Average Home Value in this Area
Purchase History
| Date | Buyer | Sale Price | Title Company |
|---|---|---|---|
| Munson Joseph L | -- | None Available | |
| Munson Barbara | -- | None Available | |
| Munson Barbara | -- | None Available | |
| Munson Larry | -- | -- | |
| Sirotko Michael J | -- | -- |
Source: Public Records
Mortgage History
| Date | Status | Borrower | Loan Amount |
|---|---|---|---|
| Open | Munson Larry | $50,000 |
Source: Public Records
Tax History Compared to Growth
Tax History
| Year | Tax Paid | Tax Assessment Tax Assessment Total Assessment is a certain percentage of the fair market value that is determined by local assessors to be the total taxable value of land and additions on the property. | Land | Improvement |
|---|---|---|---|---|
| 2025 | $2,795 | $119,800 | $0 | $0 |
| 2024 | $2,191 | $107,900 | $0 | $0 |
| 2023 | $2,093 | $87,500 | $0 | $0 |
| 2022 | $2,551 | $74,900 | $0 | $0 |
| 2021 | $2,478 | $70,400 | $0 | $0 |
| 2020 | $2,451 | $65,200 | $0 | $0 |
| 2019 | $2,406 | $60,800 | $0 | $0 |
| 2018 | $2,349 | $62,500 | $0 | $0 |
| 2017 | $2,295 | $61,800 | $0 | $0 |
| 2016 | $1,777 | $58,300 | $0 | $0 |
| 2015 | -- | $56,300 | $0 | $0 |
| 2014 | $2,132 | $57,400 | $0 | $0 |
| 2013 | -- | $55,100 | $0 | $0 |
Source: Public Records
Map
Nearby Homes
- 1848 Forest Park Rd
- 1991 W Glen Ct
- 4235 Braeburn Ct
- 4230 Braeburn Ct
- 1812 Ritter Hills Dr
- 1558 Brookwood Dr
- 1905 Crestwood Ln
- 2097 Geneva Ln
- 1769 Bayview Dr
- 3891 Wickham Dr
- 3920 Braeburn Dr
- 2147 Easthill Dr
- 1947 Spencer Dr
- 1887 Hendrick Rd
- 2290 Blissfield Ct
- 3658 Lake Harbor Rd
- 5043 Maranatha Dr
- 4057 Dunes Pkwy
- 2059 Garland Dr
- 3854 Greuling Rd
- 4357 Lake Harbor Rd
- 4323 Lake Harbor Rd
- 4375 Lake Harbor Rd
- 4311 Lake Harbor Rd
- 4356 Lake Harbor Rd
- 4342 Lake Harbor Rd
- 4301 Lake Harbor Rd
- 4328 Lake Harbor Rd
- 4362 Lake Harbor Rd
- 4316 Lake Harbor Rd
- 4293 Lake Harbor Rd
- 4376 Lake Harbor Rd
- 4394 Lake Harbor Rd
- 4300 Lake Harbor Rd
- 4434 Lake Harbor Rd
- 4409 Lake Harbor Rd
- 4316 E Glen Ct
- 4412 Lake Harbor Rd
- 4332 E Glen Ct
- 4326 E Glen Ct