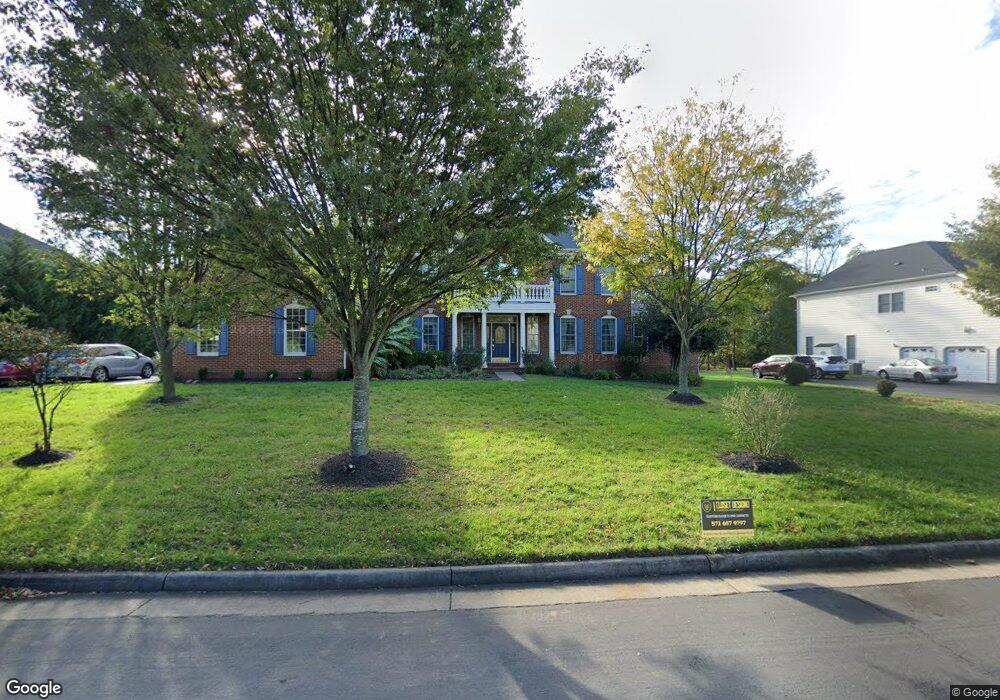
43459 Rockforest Ct Sterling, VA 20166
Estimated Value: $1,499,000 - $1,638,219
4
Beds
6
Baths
6,207
Sq Ft
$253/Sq Ft
Est. Value
About This Home
This home is located at 43459 Rockforest Ct, Sterling, VA 20166 and is currently estimated at $1,570,555, approximately $253 per square foot. 43459 Rockforest Ct is a home located in Loudoun County with nearby schools including Rosa Lee Carter Elementary School, Rock Ridge High School, and Stone Hill Middle School.
Ownership History
Date
Name
Owned For
Owner Type
Purchase Details
Closed on
Aug 21, 2020
Sold by
Rahman Mohammad Kassim and Rahman Amena A
Bought by
Yanambakkam Nagaraj and Nagaraj Medhini
Current Estimated Value
Home Financials for this Owner
Home Financials are based on the most recent Mortgage that was taken out on this home.
Original Mortgage
$745,200
Outstanding Balance
$661,045
Interest Rate
3%
Mortgage Type
New Conventional
Estimated Equity
$909,510
Purchase Details
Closed on
Nov 15, 2019
Sold by
Rahman Amena A and Rahman Mohammad Kassim
Bought by
Rahman Mohammad Kassim and Rahman Amena A
Purchase Details
Closed on
Aug 24, 2005
Sold by
Toll Va Iv L P
Bought by
Rahman Mustafa M and Rahman,Amena A
Home Financials for this Owner
Home Financials are based on the most recent Mortgage that was taken out on this home.
Original Mortgage
$550,000
Interest Rate
5.81%
Mortgage Type
New Conventional
Create a Home Valuation Report for This Property
The Home Valuation Report is an in-depth analysis detailing your home's value as well as a comparison with similar homes in the area
Home Values in the Area
Average Home Value in this Area
Purchase History
| Date | Buyer | Sale Price | Title Company |
|---|---|---|---|
| Yanambakkam Nagaraj | $1,090,000 | Settlement Services Llc | |
| Rahman Mohammad Kassim | -- | None Available | |
| Rahman Mustafa M | $923,475 | -- |
Source: Public Records
Mortgage History
| Date | Status | Borrower | Loan Amount |
|---|---|---|---|
| Open | Yanambakkam Nagaraj | $745,200 | |
| Previous Owner | Rahman Mustafa M | $550,000 |
Source: Public Records
Tax History Compared to Growth
Tax History
| Year | Tax Paid | Tax Assessment Tax Assessment Total Assessment is a certain percentage of the fair market value that is determined by local assessors to be the total taxable value of land and additions on the property. | Land | Improvement |
|---|---|---|---|---|
| 2025 | $13,058 | $1,622,150 | $416,000 | $1,206,150 |
| 2024 | $13,057 | $1,509,500 | $376,000 | $1,133,500 |
| 2023 | $12,746 | $1,456,730 | $376,000 | $1,080,730 |
| 2022 | $10,338 | $1,161,560 | $301,000 | $860,560 |
| 2021 | $10,135 | $1,034,150 | $261,000 | $773,150 |
| 2020 | $9,510 | $918,850 | $251,000 | $667,850 |
| 2019 | $8,952 | $856,680 | $251,000 | $605,680 |
| 2018 | $9,472 | $873,030 | $251,000 | $622,030 |
| 2017 | $9,635 | $856,430 | $251,000 | $605,430 |
| 2016 | $9,484 | $828,330 | $0 | $0 |
| 2015 | $9,726 | $605,880 | $0 | $605,880 |
| 2014 | $9,465 | $608,440 | $0 | $608,440 |
Source: Public Records
Map
Nearby Homes
- 23158 Glenorchy Ct
- 43186 Mongold Square
- 43179 Mongold Square
- 23647 Hopewell Manor Terrace
- 23646 Hopewell Manor Terrace
- 23475 Belvoir Woods Terrace
- 23465 Belvoir Woods Terrace
- 43011 Clarks Mill Terrace
- 23579 Belvoir Woods Terrace
- 23516 Hopewell Manor Terrace
- 43053 Thoroughfare Gap Terrace
- 23297 Southdown Manor Terrace Unit 105
- 23271 Southdown Manor Terrace Unit 108
- 23069 Weybridge Square
- 43089 Greeley Square
- 23225 Milltown Knoll Square Unit 108
- 42920 Firefly Sonata Terrace Unit 307
- 43221 Greeley Square
- 23052 Sunbury St
- Aurora Plan at Birchwood at Brambleton - Birchwood Courtyard Homes
- 43455 Rockforest Ct
- 43463 Rockforest Ct
- 23361 Lennoxville Way
- 43454 Rockforest Ct
- 43451 Rockforest Ct
- 43467 Rockforest Ct
- 43462 Rockforest Ct
- 43450 Rockforest Ct
- 23357 Lennoxville Way
- 43466 Rockforest Ct
- 43475 Rockforest Ct
- 43447 Rockforest Ct
- 23352 Lennoxville Way
- 43470 Rockforest Ct
- 43446 Rockforest Ct
- 23353 Lennoxville Way
- 43442 Rockforest Ct
- 43474 Rockforest Ct
- 43479 Rockforest Ct
- 43478 Ogden Place