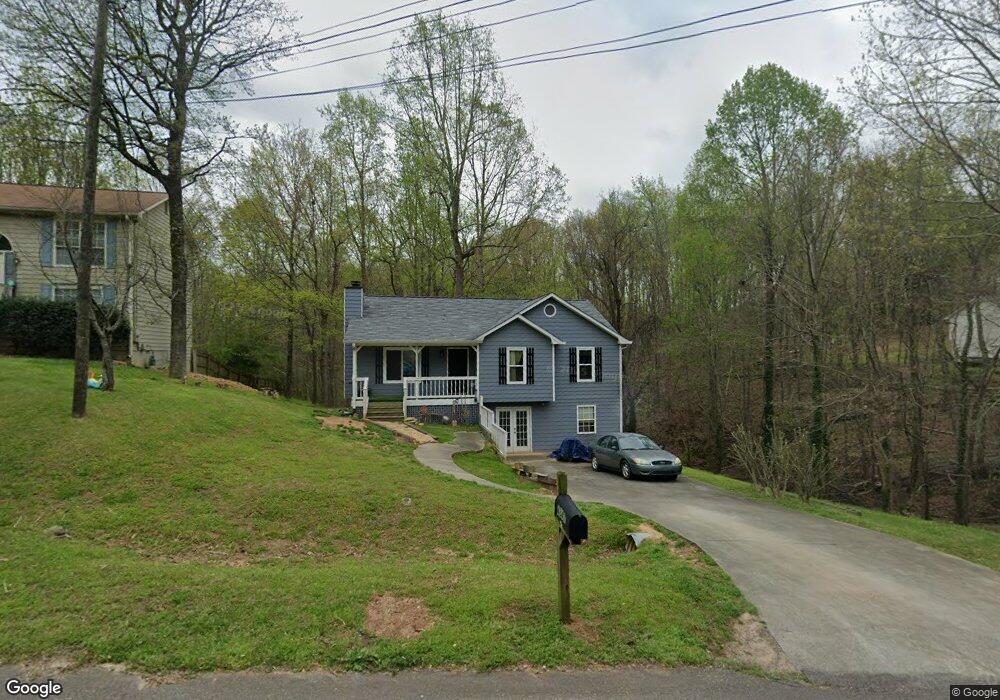
4347 Falcon Crest Dr Flowery Branch, GA 30542
Estimated Value: $295,000 - $342,000
3
Beds
2
Baths
1,268
Sq Ft
$254/Sq Ft
Est. Value
About This Home
This home is located at 4347 Falcon Crest Dr, Flowery Branch, GA 30542 and is currently estimated at $322,055, approximately $253 per square foot. 4347 Falcon Crest Dr is a home located in Hall County with nearby schools including Martin Elementary School, Southwest Middle School, and C.W. Davis Middle School.
Ownership History
Date
Name
Owned For
Owner Type
Purchase Details
Closed on
Dec 24, 2019
Sold by
Shores Melissa D
Bought by
Shores Gary W and Shores Melissa
Current Estimated Value
Purchase Details
Closed on
Jan 28, 2019
Sold by
Shores Marissa Jean
Bought by
Shores Melissa D
Purchase Details
Closed on
Apr 7, 2017
Sold by
Smith Randall M
Bought by
Shores Marissa Jean
Purchase Details
Closed on
Feb 20, 2003
Sold by
Newman Charles
Bought by
Smith Randall M and Smith Karen M
Home Financials for this Owner
Home Financials are based on the most recent Mortgage that was taken out on this home.
Original Mortgage
$66,000
Interest Rate
5.93%
Mortgage Type
New Conventional
Purchase Details
Closed on
Oct 1, 1995
Purchase Details
Closed on
Jun 1, 1993
Sold by
Bryant D Jackson Builders Inc Stephen J
Bought by
Newman Charles
Home Financials for this Owner
Home Financials are based on the most recent Mortgage that was taken out on this home.
Original Mortgage
$71,842
Interest Rate
7.45%
Mortgage Type
FHA
Purchase Details
Closed on
Feb 1, 1993
Create a Home Valuation Report for This Property
The Home Valuation Report is an in-depth analysis detailing your home's value as well as a comparison with similar homes in the area
Home Values in the Area
Average Home Value in this Area
Purchase History
| Date | Buyer | Sale Price | Title Company |
|---|---|---|---|
| Shores Gary W | -- | -- | |
| Shores Melissa D | -- | -- | |
| Shores Marissa Jean | -- | -- | |
| Smith Randall M | $82,500 | -- | |
| -- | $67,900 | -- | |
| Newman Charles | $72,900 | -- | |
| -- | $13,000 | -- |
Source: Public Records
Mortgage History
| Date | Status | Borrower | Loan Amount |
|---|---|---|---|
| Previous Owner | Smith Randall M | $66,000 | |
| Previous Owner | Newman Charles | $71,842 |
Source: Public Records
Tax History Compared to Growth
Tax History
| Year | Tax Paid | Tax Assessment Tax Assessment Total Assessment is a certain percentage of the fair market value that is determined by local assessors to be the total taxable value of land and additions on the property. | Land | Improvement |
|---|---|---|---|---|
| 2024 | $2,860 | $114,800 | $26,040 | $88,760 |
| 2023 | $2,642 | $121,840 | $23,720 | $98,120 |
| 2022 | $2,396 | $92,160 | $22,800 | $69,360 |
| 2021 | $1,908 | $71,880 | $9,480 | $62,400 |
| 2020 | $1,787 | $65,440 | $9,080 | $56,360 |
| 2019 | $1,928 | $70,040 | $9,560 | $60,480 |
| 2018 | $1,032 | $61,640 | $9,560 | $52,080 |
| 2017 | $1,356 | $46,000 | $9,560 | $36,440 |
| 2016 | $1,205 | $41,600 | $9,560 | $32,040 |
| 2015 | $1,089 | $37,040 | $9,560 | $27,480 |
| 2014 | $1,089 | $37,040 | $9,560 | $27,480 |
Source: Public Records
Map
Nearby Homes
- 4580 J M Turk Rd
- 5474 Hf Reed Industrial Pkwy
- 4626 Deer Creek Ct
- 4003 Warren Rd
- 4684 Martins Crossing Dr W
- 4860 Wildlife Way
- 3979 Alderstone Dr
- 3987 Alderstone Dr
- 4086 Parks Rd
- 3983 Alderstone Dr
- 4042 Alderstone Dr
- 0 Hog Mountain Rd Unit 9051064
- 3963 Alderstone Dr
- 4050 Alderstone Dr
- 4054 Alderstone Dr
- 4016 Laurant Path
- 4343 Falcon Crest Dr
- 4339 Falcon Crest Dr
- 4344 Falcon Crest Dr
- 4348 Falcon Crest Dr
- 4335 Falcon Crest Dr
- 4351 Falcon Crest Dr
- 4336 Falcon Crest Dr
- 4340 Falcon Crest Dr
- 4355 Falcon Crest Dr
- 4352 Falcon Crest Dr
- 4331 Falcon Crest Dr
- 4330 Falcon Crest Dr
- 4327 Falcon Crest Dr
- 4356 Falcon Crest Dr
- 4326 Falcon Crest Dr
- 4323 Falcon Crest Dr
- 4319 Martin Rd
- 4323 Martin Rd
- 4327 Martin Rd
- 4320 Falcon Crest Dr