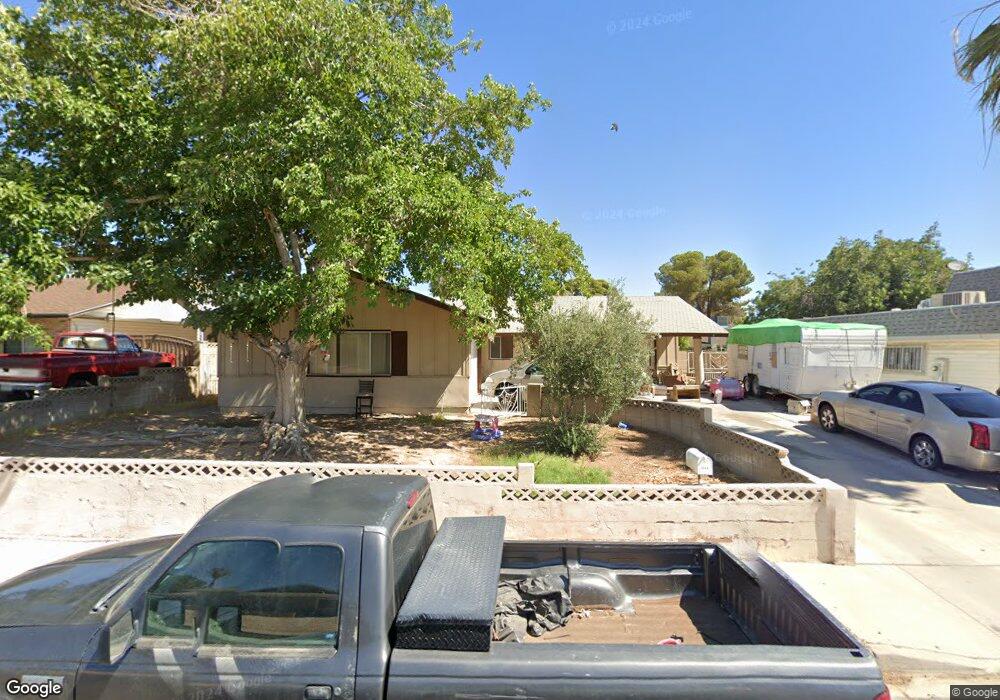
4348 El Campana Way Las Vegas, NV 89121
Paradise Valley East NeighborhoodEstimated Value: $351,000 - $412,000
3
Beds
2
Baths
1,437
Sq Ft
$263/Sq Ft
Est. Value
About This Home
This home is located at 4348 El Campana Way, Las Vegas, NV 89121 and is currently estimated at $378,062, approximately $263 per square foot. 4348 El Campana Way is a home located in Clark County with nearby schools including William E. Ferron Elementary School, C.W. Woodbury Middle School, and Chaparral High School.
Ownership History
Date
Name
Owned For
Owner Type
Purchase Details
Closed on
Jun 18, 2004
Sold by
Helmin Kurt and Helmin Lisa
Bought by
Aceves Jaime
Current Estimated Value
Home Financials for this Owner
Home Financials are based on the most recent Mortgage that was taken out on this home.
Original Mortgage
$145,600
Outstanding Balance
$70,553
Interest Rate
5.87%
Mortgage Type
Unknown
Estimated Equity
$307,509
Purchase Details
Closed on
Oct 2, 1998
Sold by
Potts Brandon A and Potts Jashelle
Bought by
Helmin Kurt and Helmin Lisa
Home Financials for this Owner
Home Financials are based on the most recent Mortgage that was taken out on this home.
Original Mortgage
$111,073
Interest Rate
6.79%
Mortgage Type
FHA
Purchase Details
Closed on
Oct 27, 1995
Sold by
Mccormick Michael E and Mccormick Carol L
Bought by
Potts Brandon A and Potts Jashelle
Home Financials for this Owner
Home Financials are based on the most recent Mortgage that was taken out on this home.
Original Mortgage
$104,806
Interest Rate
7.59%
Mortgage Type
FHA
Create a Home Valuation Report for This Property
The Home Valuation Report is an in-depth analysis detailing your home's value as well as a comparison with similar homes in the area
Home Values in the Area
Average Home Value in this Area
Purchase History
| Date | Buyer | Sale Price | Title Company |
|---|---|---|---|
| Aceves Jaime | $182,000 | Old Republic Title Co Of Ne | |
| Helmin Kurt | $112,500 | Old Republic Title Company | |
| Potts Brandon A | $106,000 | Lawyers Title |
Source: Public Records
Mortgage History
| Date | Status | Borrower | Loan Amount |
|---|---|---|---|
| Open | Aceves Jaime | $145,600 | |
| Previous Owner | Helmin Kurt | $111,073 | |
| Previous Owner | Potts Brandon A | $104,806 | |
| Closed | Aceves Jaime | $27,300 |
Source: Public Records
Tax History Compared to Growth
Tax History
| Year | Tax Paid | Tax Assessment Tax Assessment Total Assessment is a certain percentage of the fair market value that is determined by local assessors to be the total taxable value of land and additions on the property. | Land | Improvement |
|---|---|---|---|---|
| 2025 | $1,051 | $52,068 | $31,150 | $20,918 |
| 2024 | $974 | $52,068 | $31,150 | $20,918 |
| 2023 | $974 | $56,711 | $36,750 | $19,961 |
| 2022 | $902 | $50,373 | $31,500 | $18,873 |
| 2021 | $836 | $44,412 | $25,900 | $18,512 |
| 2020 | $773 | $44,109 | $25,200 | $18,909 |
| 2019 | $724 | $42,230 | $23,100 | $19,130 |
| 2018 | $691 | $40,450 | $21,700 | $18,750 |
| 2017 | $1,103 | $37,606 | $18,200 | $19,406 |
| 2016 | $648 | $32,610 | $12,250 | $20,360 |
| 2015 | $646 | $30,608 | $10,500 | $20,108 |
| 2014 | $626 | $25,967 | $6,300 | $19,667 |
Source: Public Records
Map
Nearby Homes
- 4356 Powell Ave
- 4278 El Campana Way
- 4269 Cartegena Way
- 4458 El Quinta Ct
- 4356 Sabadell St
- 4285 El Como Way
- 4310 El Antonio Place
- 4274 Gibraltar St
- 4606 Powell Ave
- 4332 Del Santos Dr
- 4625 La Fonda Dr
- 4165 Santa Terrasa Place
- 4165 Grace St
- 4072 E Harmon Ave
- 4161 Oxnard Cir
- 4567 Dennis Way
- 4062 Monthill Ave
- 4273 Hazelcrest Dr
- 3846 Syracuse Dr
- 4457 Rita Dr
- 4348 El Campana Way Unit na
- 4334 El Campana Way
- 4349 Cartegena Way Unit 3
- 4375 Cartegena Way Unit 2
- 4339 Cartegena Way
- 4378 El Campana Way
- 4324 El Campana Way
- 4353 El Campana Way
- 4341 El Campana Way
- 4385 Cartegena Way
- 4365 El Campana Way Unit 4E
- 4331 El Campana Way
- 4329 Cartegena Way
- 4314 El Campana Way
- 4321 El Campana Way
- 4395 Cartegena Way
- 4319 Cartegena Way
- 4342 Powell Ave
- 4368 Cartegena Way
- 4334 Powell Ave