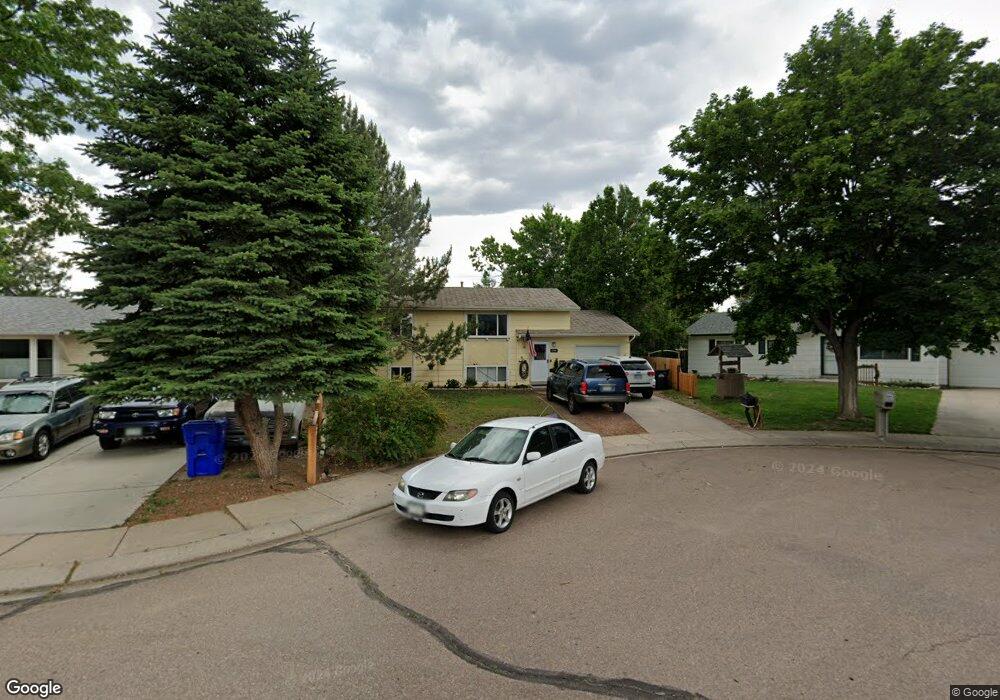
4348 Hopeful Way Colorado Springs, CO 80917
Village Seven NeighborhoodEstimated Value: $370,000 - $406,000
3
Beds
2
Baths
816
Sq Ft
$471/Sq Ft
Est. Value
About This Home
This home is located at 4348 Hopeful Way, Colorado Springs, CO 80917 and is currently estimated at $384,631, approximately $471 per square foot. 4348 Hopeful Way is a home located in El Paso County with nearby schools including Carver Elementary School, Sabin Middle School, and Doherty High School.
Ownership History
Date
Name
Owned For
Owner Type
Purchase Details
Closed on
Aug 2, 2017
Sold by
Roherbach Jessica L
Bought by
Neil Ronald O
Current Estimated Value
Home Financials for this Owner
Home Financials are based on the most recent Mortgage that was taken out on this home.
Original Mortgage
$10,064
Outstanding Balance
$8,384
Interest Rate
3.9%
Mortgage Type
Stand Alone Second
Estimated Equity
$376,247
Purchase Details
Closed on
Jun 16, 2011
Sold by
Neth Rodney C and Bradeen Neth Carol Jean
Bought by
Rohrbach Jessica L
Home Financials for this Owner
Home Financials are based on the most recent Mortgage that was taken out on this home.
Original Mortgage
$142,500
Interest Rate
4.74%
Mortgage Type
New Conventional
Purchase Details
Closed on
Jan 22, 2010
Sold by
Neth Rodney C and Neth Monika M
Bought by
Neth Rodney C and Bradeen Neth Carol Jean
Purchase Details
Closed on
Apr 1, 1981
Bought by
Oneill Ronald
Create a Home Valuation Report for This Property
The Home Valuation Report is an in-depth analysis detailing your home's value as well as a comparison with similar homes in the area
Home Values in the Area
Average Home Value in this Area
Purchase History
| Date | Buyer | Sale Price | Title Company |
|---|---|---|---|
| Neil Ronald O | $205,000 | Land Title Guarantee Co | |
| Rohrbach Jessica L | $150,000 | Capital Title | |
| Neth Rodney C | -- | None Available | |
| Oneill Ronald | -- | -- |
Source: Public Records
Mortgage History
| Date | Status | Borrower | Loan Amount |
|---|---|---|---|
| Open | Neil Ronald O | $10,064 | |
| Previous Owner | Rohrbach Jessica L | $142,500 |
Source: Public Records
Tax History Compared to Growth
Tax History
| Year | Tax Paid | Tax Assessment Tax Assessment Total Assessment is a certain percentage of the fair market value that is determined by local assessors to be the total taxable value of land and additions on the property. | Land | Improvement |
|---|---|---|---|---|
| 2025 | $1,209 | $25,920 | -- | -- |
| 2024 | $1,098 | $26,170 | $4,400 | $21,770 |
| 2023 | $1,098 | $26,170 | $4,400 | $21,770 |
| 2022 | $1,053 | $18,820 | $3,340 | $15,480 |
| 2021 | $1,142 | $19,350 | $3,430 | $15,920 |
| 2020 | $1,026 | $15,110 | $2,970 | $12,140 |
| 2019 | $1,020 | $15,110 | $2,970 | $12,140 |
| 2018 | $941 | $12,820 | $2,590 | $10,230 |
| 2017 | $891 | $12,820 | $2,590 | $10,230 |
| 2016 | $679 | $11,720 | $2,170 | $9,550 |
| 2015 | $677 | $11,720 | $2,170 | $9,550 |
| 2014 | $635 | $10,560 | $2,170 | $8,390 |
Source: Public Records
Map
Nearby Homes
- 4318 Hopeful Way
- 4350 Siferd Blvd
- 4266 Orchid St
- 4090 Hopeful Dr
- 4501 Winewood Village Dr Unit K4501
- 4685 Barnes Rd
- 4139 Park Haven View
- 4127 Park Haven View
- 4127 Park Haven
- 4534 Winewood Village Dr Unit P4534
- 4135 Neat Place
- 4242 Amiable Way
- 4649 N Crimson Cir
- 4671 Winewood Village Dr Unit X4671
- 4768 S Gracemoor Cir
- 4005 Siferd Blvd
- 4710 Cheerful Rd
- 4344 S Delighted Cir
- 4815 Del Sol Rd
- 3995 Siferd Blvd Unit 4
- 4342 Hopeful Way
- 4406 Hopeful Way
- 4336 Hopeful Way
- 4412 Hopeful Way
- 4330 Hopeful Way
- 4537 Austin Bluffs Pkwy
- 4425 Hopeful Way
- 4331 Hopeful Way
- 4424 Hopeful Way
- 4324 Hopeful Way
- 4431 Hopeful Way
- 4430 Hopeful Way
- 4537 Hopeful Way
- 4436 Hopeful Way
- 4437 Hopeful Way
- 4560 Hopeful Way
- 4531 Hopeful Way
- 4312 Hopeful Way
- 4554 Hopeful Way
- 4442 Hopeful Way