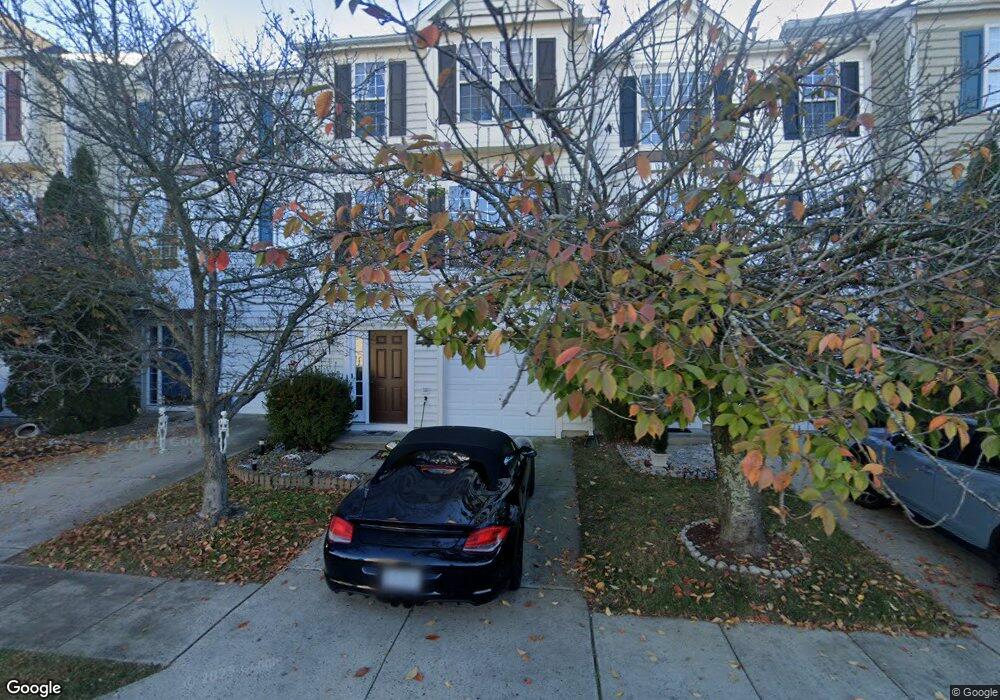
43482 Greenwich Square Ashburn, VA 20147
Estimated Value: $635,000 - $677,000
3
Beds
3
Baths
2,067
Sq Ft
$314/Sq Ft
Est. Value
About This Home
This home is located at 43482 Greenwich Square, Ashburn, VA 20147 and is currently estimated at $649,234, approximately $314 per square foot. 43482 Greenwich Square is a home located in Loudoun County with nearby schools including Discovery Elementary School, Farmwell Station Middle School, and Broad Run High School.
Ownership History
Date
Name
Owned For
Owner Type
Purchase Details
Closed on
Aug 15, 2005
Sold by
Fisher Steven K
Bought by
Phung Manh
Current Estimated Value
Home Financials for this Owner
Home Financials are based on the most recent Mortgage that was taken out on this home.
Original Mortgage
$350,000
Outstanding Balance
$182,440
Interest Rate
5.54%
Mortgage Type
New Conventional
Estimated Equity
$466,794
Purchase Details
Closed on
Jun 2, 2003
Sold by
Mcgee Lori
Bought by
Fisher Steven
Home Financials for this Owner
Home Financials are based on the most recent Mortgage that was taken out on this home.
Original Mortgage
$252,901
Interest Rate
5.86%
Mortgage Type
FHA
Purchase Details
Closed on
May 25, 2001
Sold by
Giles Tony V
Bought by
Mcgee Lori A
Home Financials for this Owner
Home Financials are based on the most recent Mortgage that was taken out on this home.
Original Mortgage
$197,907
Interest Rate
7.05%
Create a Home Valuation Report for This Property
The Home Valuation Report is an in-depth analysis detailing your home's value as well as a comparison with similar homes in the area
Home Values in the Area
Average Home Value in this Area
Purchase History
| Date | Buyer | Sale Price | Title Company |
|---|---|---|---|
| Phung Manh | $437,500 | -- | |
| Fisher Steven | $254,900 | -- | |
| Mcgee Lori A | $219,897 | -- |
Source: Public Records
Mortgage History
| Date | Status | Borrower | Loan Amount |
|---|---|---|---|
| Open | Phung Manh | $350,000 | |
| Previous Owner | Fisher Steven | $252,901 | |
| Previous Owner | Mcgee Lori A | $197,907 |
Source: Public Records
Tax History Compared to Growth
Tax History
| Year | Tax Paid | Tax Assessment Tax Assessment Total Assessment is a certain percentage of the fair market value that is determined by local assessors to be the total taxable value of land and additions on the property. | Land | Improvement |
|---|---|---|---|---|
| 2025 | $4,800 | $596,230 | $185,000 | $411,230 |
| 2024 | $4,975 | $575,100 | $175,000 | $400,100 |
| 2023 | $4,612 | $527,050 | $175,000 | $352,050 |
| 2022 | $4,550 | $511,190 | $155,000 | $356,190 |
| 2021 | $4,395 | $448,460 | $155,000 | $293,460 |
| 2020 | $4,331 | $418,410 | $140,000 | $278,410 |
| 2019 | $4,116 | $393,910 | $140,000 | $253,910 |
| 2018 | $4,221 | $389,040 | $125,000 | $264,040 |
| 2017 | $4,122 | $366,430 | $125,000 | $241,430 |
| 2016 | $4,005 | $349,740 | $0 | $0 |
| 2015 | $3,985 | $226,080 | $0 | $226,080 |
| 2014 | $3,963 | $218,110 | $0 | $218,110 |
Source: Public Records
Map
Nearby Homes
- 21493 Willow Breeze Square
- 43623 London Way
- 43314 Fullerton St
- 43756 Woodworth Ct
- 43564 Golden Meadow Cir
- 43793 Steinbeck Square
- 21701 Charity Terrace
- 43842 Artsmith Terrace
- 21755 Ladyslipper Square
- 21562 Iredell Terrace
- 43573 Patching Pond Square
- 43189 Riders Square
- 21854 Goodwood Terrace
- 43877 Sandburg Square
- Farleigh Plan at The Flats at Waxpool Crossing
- Bellister Plan at The Flats at Waxpool Crossing
- Alverton Plan at The Flats at Waxpool Crossing
- Elsdon Plan at The Flats at Waxpool Crossing
- 21731 Dovekie Terrace Unit 2206
- 21731 Dovekie Terrace Unit 2405
- 43484 Greenwich Square
- 43480 Greenwich Square
- 43486 Greenwich Square
- 43478 Greenwich Square
- 43488 Greenwich Square
- 43476 Greenwich Square
- 43472 Greenwich Square
- 43492 Greenwich Square
- 43470 Greenwich Square
- 43494 Greenwich Square
- 43468 Greenwich Square
- 43496 Greenwich Square
- 43466 Greenwich Square
- 43498 Greenwich Square
- 21490 Plymouth Place
- 21494 Plymouth Place
- 43464 Greenwich Square
- 43500 Greenwich Square
- 21486 Plymouth Place
- 43462 Greenwich Square