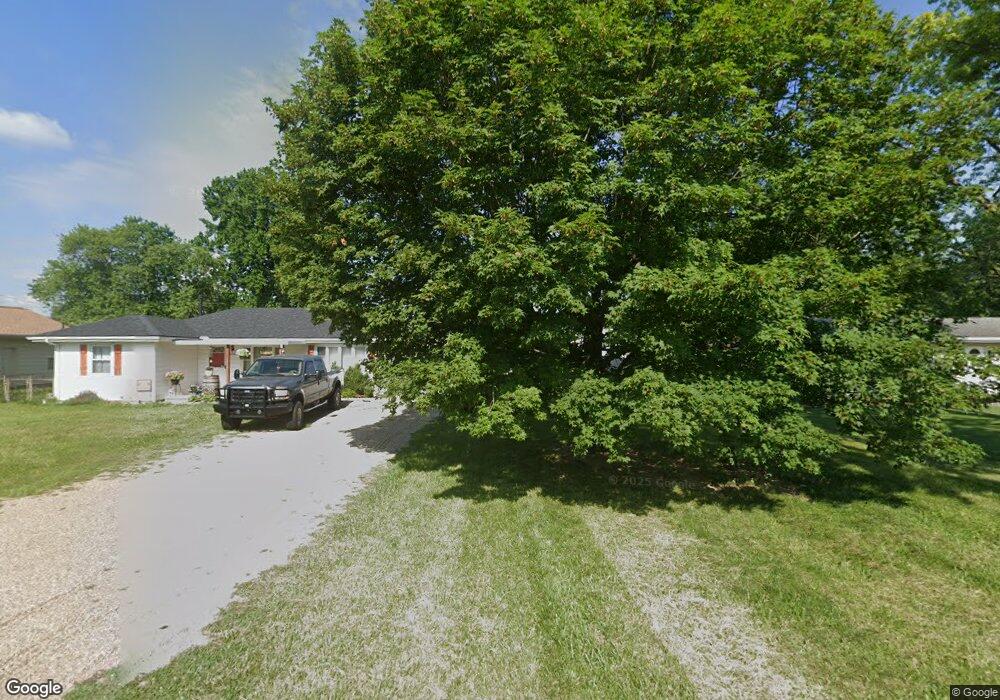
4349 Charlotte Rd Obetz, OH 43207
Obetz-Lockbourne NeighborhoodEstimated Value: $353,000 - $368,000
4
Beds
3
Baths
2,060
Sq Ft
$175/Sq Ft
Est. Value
About This Home
This home is located at 4349 Charlotte Rd, Obetz, OH 43207 and is currently estimated at $360,917, approximately $175 per square foot. 4349 Charlotte Rd is a home located in Franklin County with nearby schools including Groveport Madison High School, South Columbus Preparatory Academy at Southfield, and South Scioto Academy.
Ownership History
Date
Name
Owned For
Owner Type
Purchase Details
Closed on
Aug 9, 2021
Sold by
Hicks Michael E and Hicks Betty A
Bought by
Hicks Michael
Current Estimated Value
Home Financials for this Owner
Home Financials are based on the most recent Mortgage that was taken out on this home.
Original Mortgage
$137,750
Interest Rate
2.8%
Mortgage Type
New Conventional
Purchase Details
Closed on
Mar 22, 1996
Sold by
Rockford Homes Inc
Bought by
Hicks Michael E and Hicks Betty A
Home Financials for this Owner
Home Financials are based on the most recent Mortgage that was taken out on this home.
Original Mortgage
$96,400
Interest Rate
7.06%
Mortgage Type
New Conventional
Purchase Details
Closed on
Apr 5, 1994
Purchase Details
Closed on
Apr 23, 1993
Create a Home Valuation Report for This Property
The Home Valuation Report is an in-depth analysis detailing your home's value as well as a comparison with similar homes in the area
Home Values in the Area
Average Home Value in this Area
Purchase History
| Date | Buyer | Sale Price | Title Company |
|---|---|---|---|
| Hicks Michael | -- | None Listed On Document | |
| Hicks Michael E | $131,406 | -- | |
| -- | $45,200 | -- | |
| -- | -- | -- |
Source: Public Records
Mortgage History
| Date | Status | Borrower | Loan Amount |
|---|---|---|---|
| Previous Owner | Hicks Michael | $137,750 | |
| Previous Owner | Hicks Michael E | $96,400 |
Source: Public Records
Tax History Compared to Growth
Tax History
| Year | Tax Paid | Tax Assessment Tax Assessment Total Assessment is a certain percentage of the fair market value that is determined by local assessors to be the total taxable value of land and additions on the property. | Land | Improvement |
|---|---|---|---|---|
| 2024 | $4,242 | $116,350 | $27,200 | $89,150 |
| 2023 | $4,167 | $116,340 | $27,195 | $89,145 |
| 2022 | $3,461 | $70,910 | $14,000 | $56,910 |
| 2021 | $3,095 | $70,910 | $14,000 | $56,910 |
| 2020 | $3,077 | $70,910 | $14,000 | $56,910 |
| 2019 | $2,662 | $56,210 | $11,200 | $45,010 |
| 2018 | $2,669 | $56,210 | $11,200 | $45,010 |
| 2017 | $2,663 | $56,210 | $11,200 | $45,010 |
| 2016 | $2,688 | $53,170 | $11,270 | $41,900 |
| 2015 | $2,687 | $53,170 | $11,270 | $41,900 |
| 2014 | $2,690 | $53,170 | $11,270 | $41,900 |
| 2013 | $1,258 | $50,645 | $10,745 | $39,900 |
Source: Public Records
Map
Nearby Homes
- 4310 Charlotte Rd
- 2222 Maureen Blvd S
- 2229 Maureen Blvd N
- 2318 Rodger Rd
- 4524 Sandridge St
- 4383 Lancaster Ave
- 0 Alum Creek Dr Unit 225007823
- 4417 Lancaster Ave
- 1670 Marshall Ave
- 1640 Obetz Ave
- 2652 Millview Dr
- 1566 Chillicothe St
- 1632 Marlboro Ave
- 2715 Buggywhip Ln
- 1559 Obetz Ave
- 2698 Moonlight Ln
- 1456 Magoffin Ave
- 2651 Winningwillow Dr
- 2587 Winningwillow Dr
- 1987 Reese Ave
- 4343 Charlotte Rd
- 4357 Charlotte Rd
- 4339 Charlotte Rd
- 4353 Charlotte Rd
- 4365 Charlotte Rd
- 4346 Charlotte Rd
- 4338 Charlotte Rd
- 4362 Charlotte Rd
- 4373 Charlotte Rd
- 4330 Charlotte Rd
- 4323 Charlotte Rd
- 4369 Charlotte Rd
- 4381 Charlotte Rd
- 4378 Charlotte Rd
- 4340 Charlotte Rd
- 4354 Charlotte Rd
- 4354 Charlotte Rd
- 4327 Poplar Ct
- 4324 Poplar Ct
- 4326 Charlotte Rd