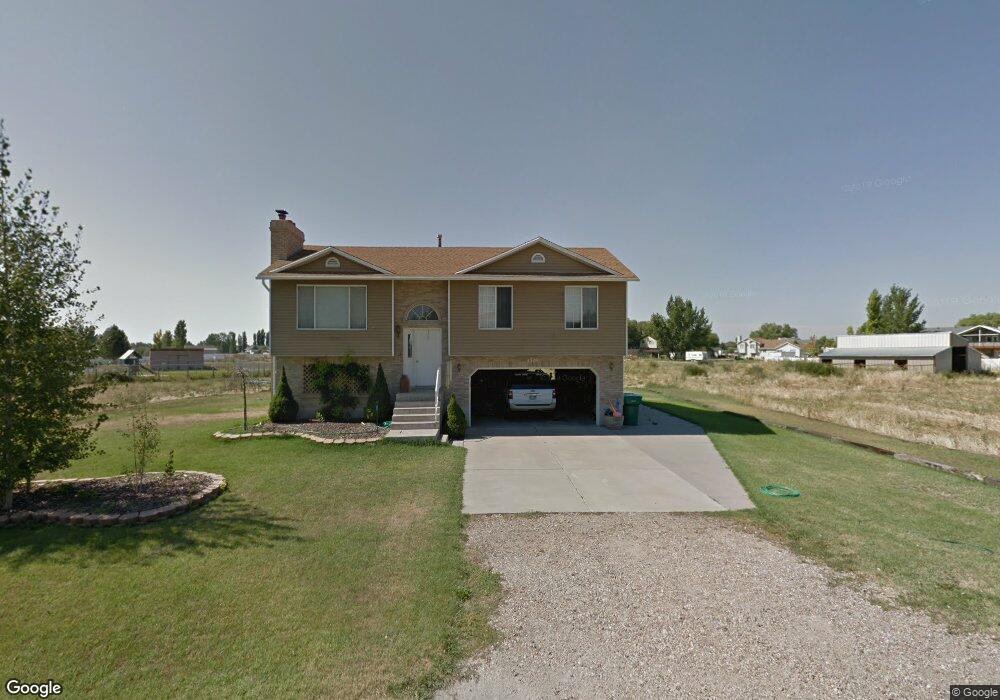
4349 S 4375 W West Haven, UT 84401
Estimated Value: $504,000 - $617,000
3
Beds
2
Baths
1,841
Sq Ft
$317/Sq Ft
Est. Value
About This Home
This home is located at 4349 S 4375 W, West Haven, UT 84401 and is currently estimated at $583,168, approximately $316 per square foot. 4349 S 4375 W is a home located in Weber County with nearby schools including Country View School, Rocky Mountain Junior High School, and Fremont High School.
Ownership History
Date
Name
Owned For
Owner Type
Purchase Details
Closed on
May 10, 2005
Sold by
Mellinger Brian S
Bought by
Mellinger Brian S
Current Estimated Value
Home Financials for this Owner
Home Financials are based on the most recent Mortgage that was taken out on this home.
Original Mortgage
$25,950
Outstanding Balance
$19,740
Interest Rate
6.02%
Mortgage Type
Credit Line Revolving
Estimated Equity
$563,428
Purchase Details
Closed on
Aug 25, 2003
Sold by
Citifinancial Mortgage Co Inc
Bought by
Mellinger Brian S
Home Financials for this Owner
Home Financials are based on the most recent Mortgage that was taken out on this home.
Original Mortgage
$113,200
Interest Rate
6.06%
Mortgage Type
Purchase Money Mortgage
Purchase Details
Closed on
Feb 25, 2003
Sold by
Woodruff Robert W and Woodruff Terrilin
Bought by
Associates First Capital Corp
Create a Home Valuation Report for This Property
The Home Valuation Report is an in-depth analysis detailing your home's value as well as a comparison with similar homes in the area
Home Values in the Area
Average Home Value in this Area
Purchase History
| Date | Buyer | Sale Price | Title Company |
|---|---|---|---|
| Mellinger Brian S | -- | Surety Title | |
| Mellinger Brian S | -- | Surety Title | |
| Associates First Capital Corp | $129,000 | First Southwestern Title |
Source: Public Records
Mortgage History
| Date | Status | Borrower | Loan Amount |
|---|---|---|---|
| Open | Mellinger Brian S | $25,950 | |
| Open | Mellinger Brian S | $141,600 | |
| Closed | Mellinger Brian S | $113,200 | |
| Closed | Mellinger Brian S | $28,300 |
Source: Public Records
Tax History Compared to Growth
Tax History
| Year | Tax Paid | Tax Assessment Tax Assessment Total Assessment is a certain percentage of the fair market value that is determined by local assessors to be the total taxable value of land and additions on the property. | Land | Improvement |
|---|---|---|---|---|
| 2025 | $3,124 | $527,447 | $181,083 | $346,364 |
| 2024 | $2,999 | $301,222 | $99,595 | $201,627 |
| 2023 | $2,922 | $290,914 | $99,596 | $191,318 |
| 2022 | $2,961 | $285,450 | $99,596 | $185,854 |
| 2021 | $2,550 | $409,000 | $95,369 | $313,631 |
| 2020 | $2,446 | $364,999 | $81,151 | $283,848 |
| 2019 | $2,344 | $329,000 | $80,761 | $248,239 |
| 2018 | $2,119 | $286,001 | $66,992 | $219,009 |
| 2017 | $1,856 | $241,000 | $66,380 | $174,620 |
| 2016 | $1,771 | $133,272 | $29,831 | $103,441 |
| 2015 | $1,729 | $128,346 | $29,831 | $98,515 |
| 2014 | $1,605 | $116,248 | $29,831 | $86,417 |
Source: Public Records
Map
Nearby Homes
- 4712 W 4100 S
- 4521 W 3950 S Unit 5
- 4512 W 3925 S Unit 20
- 3880 S 4550 W
- 4080 W 4000 S
- 4756 S 4300 W
- 4126 S 4950 W
- 4094 W 4700 S
- 4024 W 4650 S
- 3984 W 4000 S
- 4097 W 4750 S
- 3795 S 4250 W Unit D
- 4585 W 3725 S Unit 246
- 4589 W 3725 S Unit 248
- 3786 S 4250 W Unit A/ 427
- 4106 W 4875 S
- 4618 W 3725 S Unit 233
- 4622 W 3725 S Unit 231
- 4141 W 4875 S
- 4556 W 4950 S