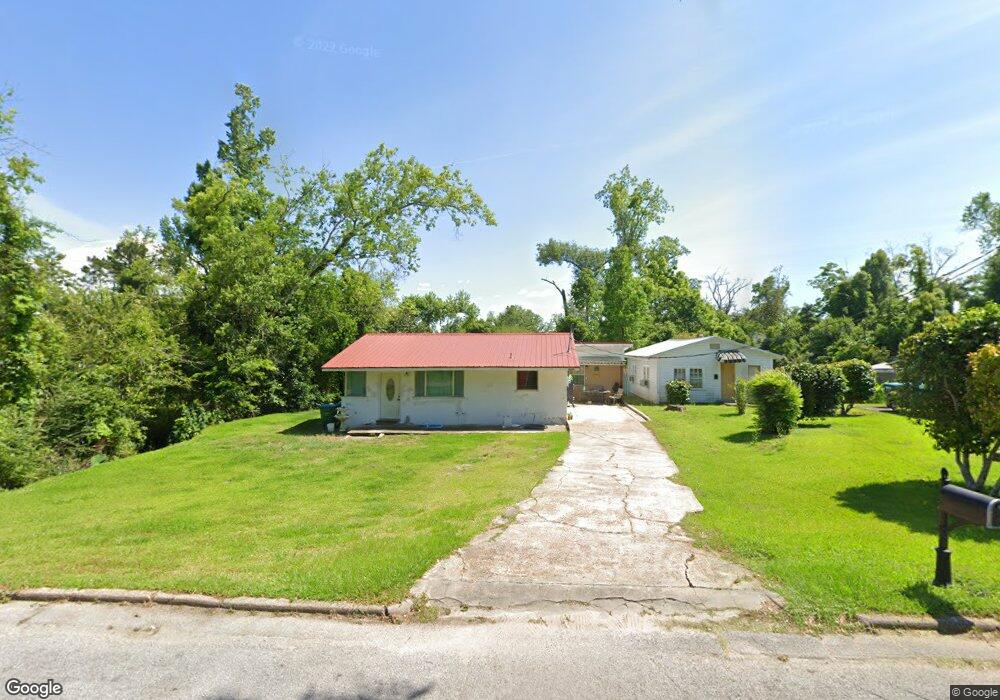
4349 Wilton St Marianna, FL 32446
Estimated Value: $162,000 - $206,000
4
Beds
2
Baths
1,776
Sq Ft
$99/Sq Ft
Est. Value
About This Home
This home is located at 4349 Wilton St, Marianna, FL 32446 and is currently estimated at $176,371, approximately $99 per square foot. 4349 Wilton St is a home located in Jackson County with nearby schools including Marianna K-8 School and Marianna High School.
Ownership History
Date
Name
Owned For
Owner Type
Purchase Details
Closed on
Feb 17, 2016
Sold by
Bank Of America Na
Bought by
Graham Paradise A and Graham Brian Lee
Current Estimated Value
Purchase Details
Closed on
Jul 2, 2015
Sold by
Furr Andrew G
Bought by
Bank Of America Na
Purchase Details
Closed on
May 14, 2007
Sold by
Parks John G and Parks Ruth N
Bought by
Furr Andrew G and Furr Marsha D
Home Financials for this Owner
Home Financials are based on the most recent Mortgage that was taken out on this home.
Original Mortgage
$97,100
Interest Rate
6.12%
Mortgage Type
New Conventional
Purchase Details
Closed on
May 9, 2007
Sold by
Evans Sam F and Evans Jeffie W
Bought by
Parks John G and Parks Ruth N
Home Financials for this Owner
Home Financials are based on the most recent Mortgage that was taken out on this home.
Original Mortgage
$97,100
Interest Rate
6.12%
Mortgage Type
New Conventional
Create a Home Valuation Report for This Property
The Home Valuation Report is an in-depth analysis detailing your home's value as well as a comparison with similar homes in the area
Home Values in the Area
Average Home Value in this Area
Purchase History
| Date | Buyer | Sale Price | Title Company |
|---|---|---|---|
| Graham Paradise A | $14,000 | Servicelink Llc | |
| Bank Of America Na | -- | None Available | |
| Furr Andrew G | $90,000 | Marianna Title Services Inc | |
| Parks John G | $6,600 | Attorney |
Source: Public Records
Mortgage History
| Date | Status | Borrower | Loan Amount |
|---|---|---|---|
| Previous Owner | Furr Andrew G | $97,100 |
Source: Public Records
Tax History Compared to Growth
Tax History
| Year | Tax Paid | Tax Assessment Tax Assessment Total Assessment is a certain percentage of the fair market value that is determined by local assessors to be the total taxable value of land and additions on the property. | Land | Improvement |
|---|---|---|---|---|
| 2024 | $1,479 | $87,696 | $13,375 | $74,321 |
| 2023 | $1,318 | $84,356 | $13,375 | $70,981 |
| 2022 | $1,124 | $73,074 | $13,375 | $59,699 |
| 2021 | $1,162 | $75,214 | $13,375 | $61,839 |
| 2020 | $1,064 | $65,869 | $13,375 | $52,494 |
| 2019 | $655 | $38,893 | $13,375 | $25,518 |
| 2018 | $1,096 | $65,751 | $13,375 | $52,376 |
| 2017 | $1,096 | $65,617 | $12,250 | $53,367 |
| 2016 | $1,098 | $66,816 | $12,250 | $54,566 |
| 2015 | $1,057 | $67,993 | $12,250 | $55,743 |
| 2014 | -- | $70,070 | $12,250 | $57,820 |
Source: Public Records
Map
Nearby Homes
- 2936 Russ St
- 4391 Florence Dr
- 4396 Florence Dr
- 2915 Wynn St
- 2939 Caledonia St
- 2935 Russ St
- 2916 Russ St
- 2956 Caledonia St
- 2973 Caledonia St
- 4388 Clinton St
- 2986 Daniels St
- 0 Lafayette (Hwy 90) Unit 773804
- 0 Lafayette (Hwy 90) Unit 773802
- TBD Highway 90
- 00 Highway 90
- 2930 Green St
- 2972 Jefferson St
- 0000 Jefferson St
- 2982 Jefferson St
- 2994 Jefferson St