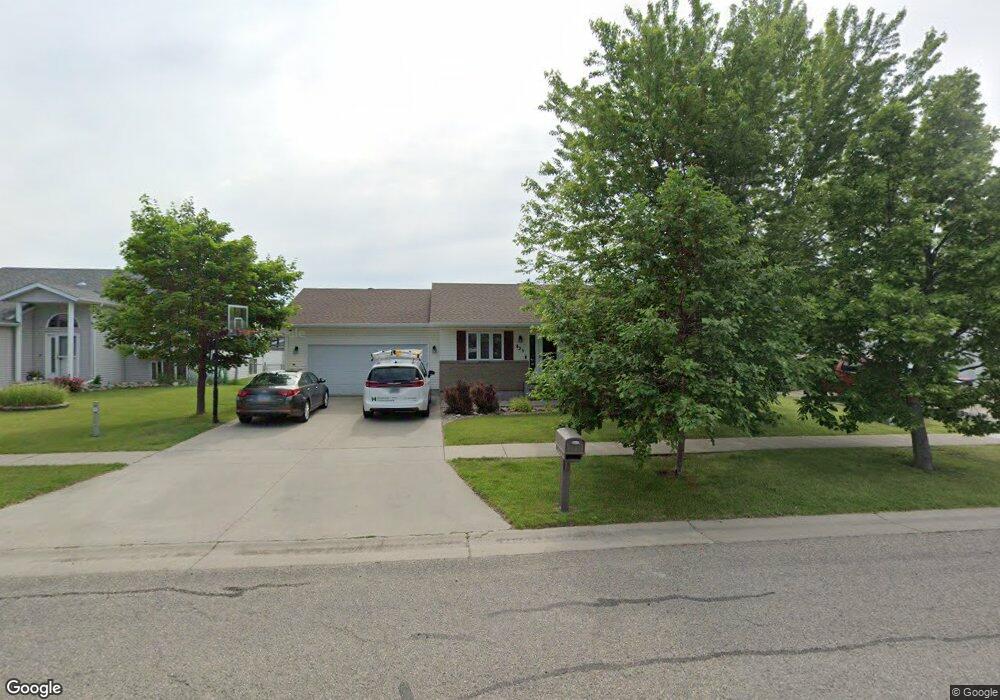
435 11th St W West Fargo, ND 58078
Westwynd NeighborhoodEstimated Value: $332,000 - $363,783
5
Beds
3
Baths
2,240
Sq Ft
$155/Sq Ft
Est. Value
About This Home
This home is located at 435 11th St W, West Fargo, ND 58078 and is currently estimated at $347,892, approximately $155 per square foot. 435 11th St W is a home located in Cass County with nearby schools including Westside Elementary School, Cheney Middle School, and West Fargo High School.
Ownership History
Date
Name
Owned For
Owner Type
Purchase Details
Closed on
Jun 14, 2019
Sold by
Schlader Mark F and Schlader Melissa A
Bought by
Anderson Casey J
Current Estimated Value
Home Financials for this Owner
Home Financials are based on the most recent Mortgage that was taken out on this home.
Original Mortgage
$234,740
Outstanding Balance
$205,975
Interest Rate
4%
Mortgage Type
New Conventional
Estimated Equity
$141,917
Purchase Details
Closed on
Aug 24, 2007
Sold by
Miller Dennis D and Miller Sharon L
Bought by
Schlader Mark F and Schlader Melissa A
Home Financials for this Owner
Home Financials are based on the most recent Mortgage that was taken out on this home.
Original Mortgage
$155,000
Interest Rate
6.77%
Mortgage Type
New Conventional
Purchase Details
Closed on
Aug 16, 2007
Sold by
Tintes Wallace and Tintes Mary Ann
Bought by
Schlader Mark F and Schlader Melissa A
Home Financials for this Owner
Home Financials are based on the most recent Mortgage that was taken out on this home.
Original Mortgage
$155,000
Interest Rate
6.77%
Mortgage Type
New Conventional
Purchase Details
Closed on
Jan 23, 2006
Sold by
Miller Steven D and Miller Jill R
Bought by
Miller Dennis D and Miller Sharon L
Home Financials for this Owner
Home Financials are based on the most recent Mortgage that was taken out on this home.
Original Mortgage
$102,000
Interest Rate
5.75%
Mortgage Type
New Conventional
Create a Home Valuation Report for This Property
The Home Valuation Report is an in-depth analysis detailing your home's value as well as a comparison with similar homes in the area
Home Values in the Area
Average Home Value in this Area
Purchase History
| Date | Buyer | Sale Price | Title Company |
|---|---|---|---|
| Anderson Casey J | $242,000 | Regency Title Inc | |
| Schlader Mark F | -- | -- | |
| Schlader Mark F | -- | -- | |
| Miller Dennis D | -- | -- |
Source: Public Records
Mortgage History
| Date | Status | Borrower | Loan Amount |
|---|---|---|---|
| Open | Anderson Casey J | $234,740 | |
| Previous Owner | Schlader Mark F | $155,000 | |
| Previous Owner | Miller Dennis D | $102,000 |
Source: Public Records
Tax History Compared to Growth
Tax History
| Year | Tax Paid | Tax Assessment Tax Assessment Total Assessment is a certain percentage of the fair market value that is determined by local assessors to be the total taxable value of land and additions on the property. | Land | Improvement |
|---|---|---|---|---|
| 2024 | $3,748 | $140,500 | $21,900 | $118,600 |
| 2023 | $4,178 | $137,250 | $21,900 | $115,350 |
| 2022 | $4,119 | $129,400 | $21,900 | $107,500 |
| 2021 | $4,012 | $121,200 | $20,100 | $101,100 |
| 2020 | $3,842 | $116,850 | $20,100 | $96,750 |
| 2019 | $3,805 | $115,300 | $20,100 | $95,200 |
| 2018 | $3,557 | $114,300 | $20,100 | $94,200 |
| 2017 | $3,249 | $113,350 | $20,100 | $93,250 |
| 2016 | $2,770 | $110,650 | $20,100 | $90,550 |
| 2015 | $2,726 | $100,150 | $11,550 | $88,600 |
| 2014 | $2,664 | $93,600 | $11,550 | $82,050 |
| 2013 | $3,035 | $91,200 | $11,550 | $79,650 |
Source: Public Records
Map
Nearby Homes