435 8th St Burlington, CO 80807
Estimated Value: $80,000 - $158,000
2
Beds
1
Bath
1,056
Sq Ft
$117/Sq Ft
Est. Value
About This Home
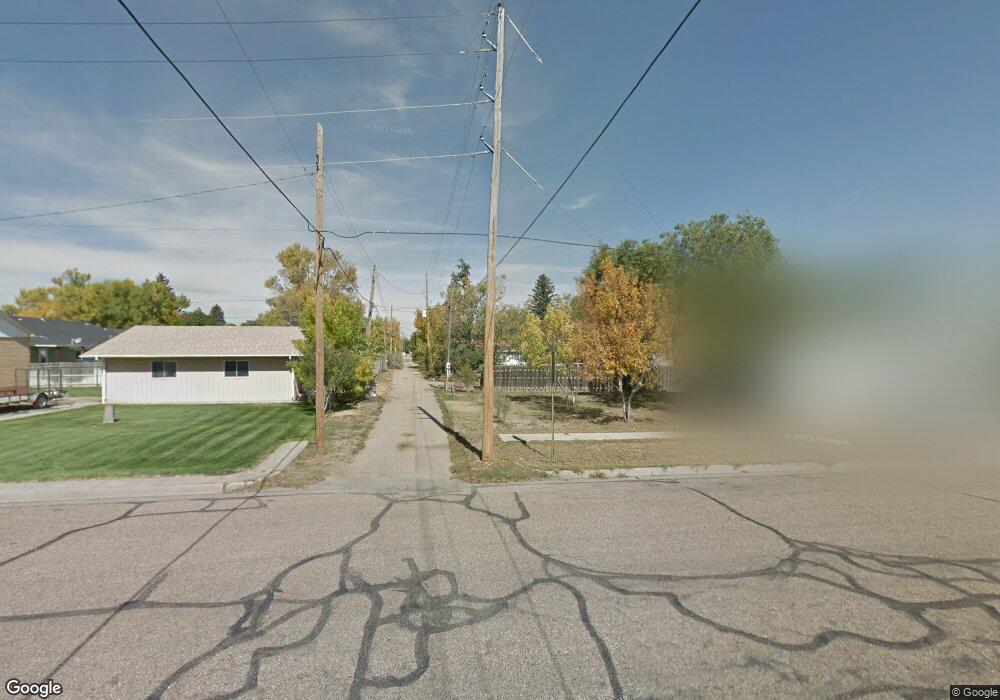
This home is located at 435 8th St, Burlington, CO 80807 and is currently estimated at $123,877, approximately $117 per square foot. 435 8th St is a home located in Kit Carson County with nearby schools including Burlington Elementary School, Burlington Middle School, and Burlington High School.
Ownership History
Date
Name
Owned For
Owner Type
Purchase Details
Closed on
Sep 16, 2025
Sold by
Baker Nada C and Randall Nada C
Bought by
Randall Nada C
Current Estimated Value
Purchase Details
Closed on
Nov 29, 2023
Sold by
Sharp Jim and Sharp Phillis A
Bought by
Baker Nada C
Home Financials for this Owner
Home Financials are based on the most recent Mortgage that was taken out on this home.
Original Mortgage
$50,000
Interest Rate
5%
Mortgage Type
Seller Take Back
Purchase Details
Closed on
Mar 21, 2023
Sold by
Chavez Luis
Bought by
Sharp Jlm and Sharp Phillis A
Purchase Details
Closed on
Feb 1, 2021
Sold by
Sharp And Sons Inc
Bought by
Chavez Luis and Chavez Nohemi
Home Financials for this Owner
Home Financials are based on the most recent Mortgage that was taken out on this home.
Original Mortgage
$80,000
Interest Rate
2.67%
Mortgage Type
Purchase Money Mortgage
Create a Home Valuation Report for This Property
The Home Valuation Report is an in-depth analysis detailing your home's value as well as a comparison with similar homes in the area
Home Values in the Area
Average Home Value in this Area
Purchase History
| Date | Buyer | Sale Price | Title Company |
|---|---|---|---|
| Randall Nada C | -- | None Listed On Document | |
| Baker Nada C | -- | None Listed On Document | |
| Sharp Jlm | $98,000 | None Listed On Document | |
| Chavez Luis | $80,000 | None Available |
Source: Public Records
Mortgage History
| Date | Status | Borrower | Loan Amount |
|---|---|---|---|
| Previous Owner | Baker Nada C | $50,000 | |
| Previous Owner | Chavez Luis | $80,000 |
Source: Public Records
Tax History Compared to Growth
Tax History
| Year | Tax Paid | Tax Assessment Tax Assessment Total Assessment is a certain percentage of the fair market value that is determined by local assessors to be the total taxable value of land and additions on the property. | Land | Improvement |
|---|---|---|---|---|
| 2024 | $137 | $1,473 | $214 | $1,259 |
| 2023 | $137 | $1,473 | $214 | $1,259 |
| 2022 | $369 | $4,496 | $559 | $3,937 |
| 2021 | $375 | $4,626 | $576 | $4,050 |
| 2020 | $317 | $3,962 | $501 | $3,461 |
| 2019 | $317 | $3,962 | $501 | $3,461 |
| 2018 | $307 | $3,827 | $504 | $3,323 |
| 2017 | $306 | $3,815 | $0 | $0 |
| 2016 | $306 | $3,815 | $0 | $0 |
| 2015 | $304 | $0 | $0 | $0 |
| 2014 | $296 | $0 | $0 | $0 |
Source: Public Records
Map
Nearby Homes