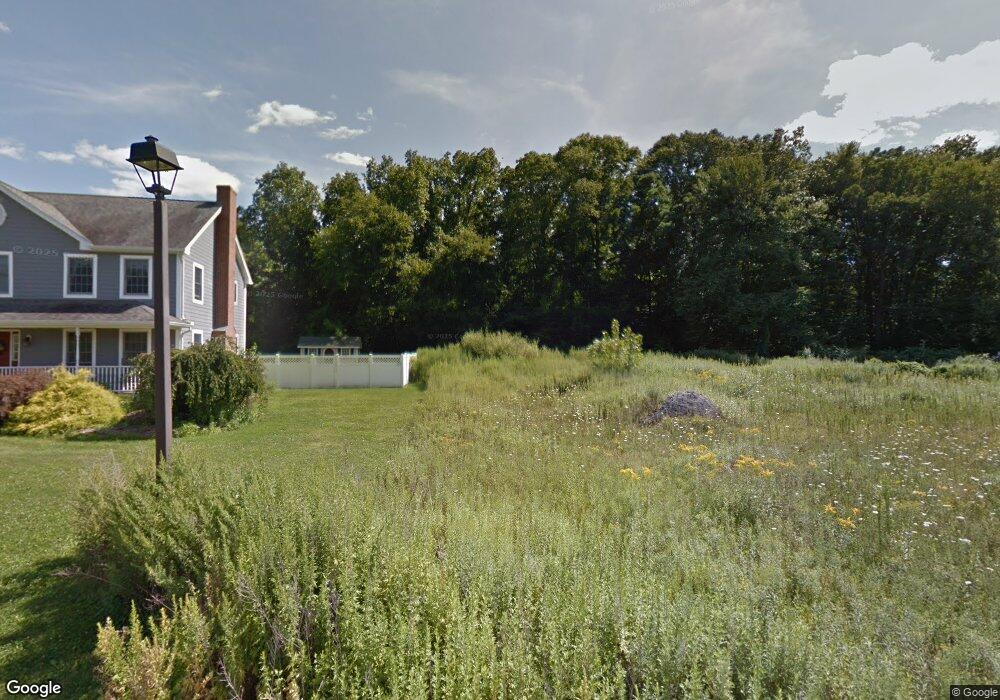
435 Allen Ave Meriden, CT 06451
Estimated Value: $609,000 - $720,000
3
Beds
3
Baths
2,880
Sq Ft
$225/Sq Ft
Est. Value
About This Home
This home is located at 435 Allen Ave, Meriden, CT 06451 and is currently estimated at $649,230, approximately $225 per square foot. 435 Allen Ave is a home located in New Haven County with nearby schools including Hanover School, Lincoln Middle School, and Orville H. Platt High School.
Ownership History
Date
Name
Owned For
Owner Type
Purchase Details
Closed on
Jun 17, 2020
Sold by
Castle View West Llc
Bought by
Lohmann Erik
Current Estimated Value
Purchase Details
Closed on
Mar 14, 2014
Sold by
Res E H Bradford Qual
Bought by
Bradford Elsa H Est
Purchase Details
Closed on
May 1, 1997
Sold by
Bradford Samuel C
Bought by
Vanwormer Laura E
Home Financials for this Owner
Home Financials are based on the most recent Mortgage that was taken out on this home.
Original Mortgage
$155,000
Interest Rate
7.85%
Mortgage Type
Unknown
Create a Home Valuation Report for This Property
The Home Valuation Report is an in-depth analysis detailing your home's value as well as a comparison with similar homes in the area
Home Values in the Area
Average Home Value in this Area
Purchase History
| Date | Buyer | Sale Price | Title Company |
|---|---|---|---|
| Lohmann Erik | -- | None Available | |
| Bradford Elsa H Est | -- | -- | |
| Vanwormer Laura E | $195,000 | -- |
Source: Public Records
Mortgage History
| Date | Status | Borrower | Loan Amount |
|---|---|---|---|
| Previous Owner | Vanwormer Laura E | $155,000 |
Source: Public Records
Tax History Compared to Growth
Tax History
| Year | Tax Paid | Tax Assessment Tax Assessment Total Assessment is a certain percentage of the fair market value that is determined by local assessors to be the total taxable value of land and additions on the property. | Land | Improvement |
|---|---|---|---|---|
| 2025 | $13,586 | $338,800 | $151,760 | $187,040 |
| 2024 | $12,302 | $338,800 | $151,760 | $187,040 |
| 2023 | $11,178 | $321,300 | $151,760 | $169,540 |
| 2022 | $10,600 | $321,300 | $151,760 | $169,540 |
| 2021 | $10,961 | $268,261 | $118,251 | $150,010 |
| 2020 | $10,961 | $268,261 | $118,251 | $150,010 |
| 2019 | $10,961 | $268,261 | $118,251 | $150,010 |
| 2018 | $11,009 | $268,261 | $118,251 | $150,010 |
| 2017 | $10,709 | $268,261 | $118,251 | $150,010 |
| 2016 | $10,035 | $267,820 | $107,590 | $160,230 |
| 2015 | $9,810 | $267,820 | $107,590 | $160,230 |
| 2014 | $9,572 | $267,820 | $107,590 | $160,230 |
Source: Public Records
Map
Nearby Homes
- 194 Debbie Dr
- 661 Allen Ave
- 51 Sperry Ln
- 58 Spruce St
- 186 Gwen Rd
- 19 Smithfield Ave
- 274 Riverside Dr
- 105 Riverside Dr
- 295 & 305 (Lot 103 & Oregon St
- 795 W Main St Unit C
- 45 Craig Ave
- 55 Peacock Dr
- 336 Reservoir Ave
- 199 Glen Hills Rd
- 380 Glen Hills Rd
- 277 Reservoir Ave Unit 701
- 16 Greenway Place
- 176 Hancock St
- 7 Pettit Dr
- 66 Dana Ln