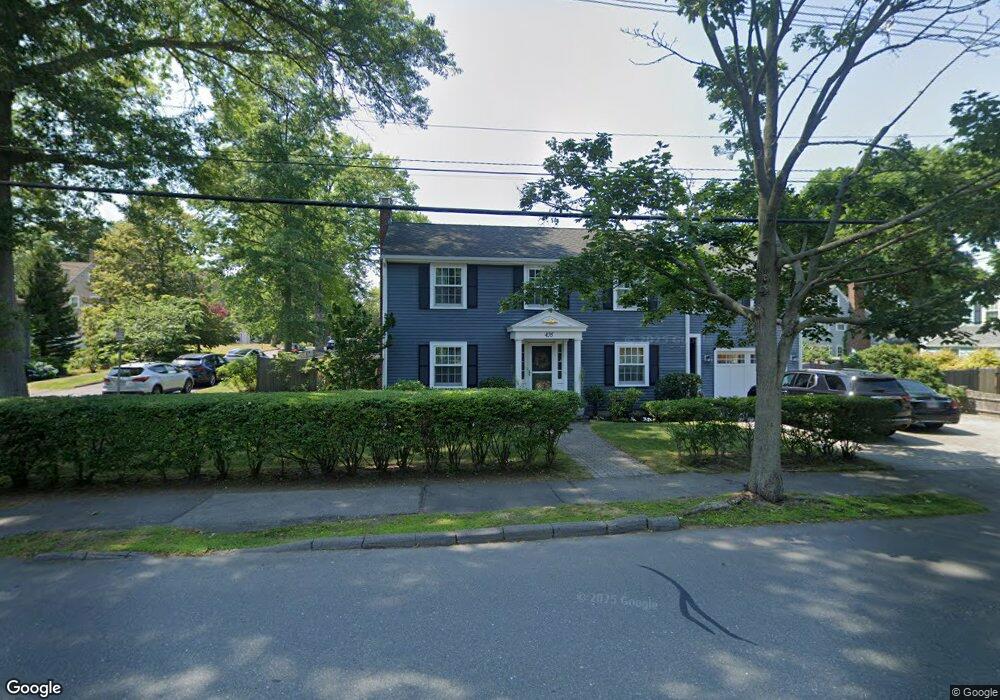
435 Atlantic Ave Marblehead, MA 01945
Estimated Value: $903,000 - $1,316,000
5
Beds
3
Baths
3,319
Sq Ft
$336/Sq Ft
Est. Value
About This Home
This home is located at 435 Atlantic Ave, Marblehead, MA 01945 and is currently estimated at $1,115,767, approximately $336 per square foot. 435 Atlantic Ave is a home located in Essex County with nearby schools including Marblehead High School, Devereux School, and Tower School.
Ownership History
Date
Name
Owned For
Owner Type
Purchase Details
Closed on
Mar 1, 2004
Sold by
Orr Marilyn E and Orr Richard C
Bought by
Bottari Louis
Current Estimated Value
Purchase Details
Closed on
Oct 31, 1997
Sold by
Simmons Robert E and Simmons Pamela J
Bought by
Orr Richard C
Purchase Details
Closed on
May 29, 1992
Sold by
Gerber James M and Gerber Nina G
Bought by
Simmons Robert and Simmons Pamela J
Create a Home Valuation Report for This Property
The Home Valuation Report is an in-depth analysis detailing your home's value as well as a comparison with similar homes in the area
Home Values in the Area
Average Home Value in this Area
Purchase History
| Date | Buyer | Sale Price | Title Company |
|---|---|---|---|
| Bottari Louis | $499,000 | -- | |
| Orr Richard C | $258,000 | -- | |
| Simmons Robert | $229,000 | -- |
Source: Public Records
Mortgage History
| Date | Status | Borrower | Loan Amount |
|---|---|---|---|
| Open | Simmons Robert | $375,000 | |
| Closed | Simmons Robert | $47,830 | |
| Closed | Simmons Robert | $50,000 |
Source: Public Records
Tax History
| Year | Tax Paid | Tax Assessment Tax Assessment Total Assessment is a certain percentage of the fair market value that is determined by local assessors to be the total taxable value of land and additions on the property. | Land | Improvement |
|---|---|---|---|---|
| 2025 | $10,277 | $1,135,600 | $594,200 | $541,400 |
| 2024 | $9,123 | $1,018,200 | $495,100 | $523,100 |
| 2023 | $9,143 | $914,300 | $495,100 | $419,200 |
| 2022 | $9,132 | $868,100 | $458,000 | $410,100 |
| 2021 | $8,723 | $837,100 | $433,200 | $403,900 |
| 2020 | $8,494 | $817,500 | $433,200 | $384,300 |
| 2019 | $8,171 | $760,800 | $396,100 | $364,700 |
| 2018 | $7,839 | $711,300 | $346,600 | $364,700 |
| 2017 | $7,059 | $641,100 | $334,200 | $306,900 |
| 2016 | $6,105 | $550,000 | $284,700 | $265,300 |
| 2015 | $5,957 | $537,600 | $272,300 | $265,300 |
| 2014 | $5,313 | $479,100 | $247,600 | $231,500 |
Source: Public Records
Map
Nearby Homes
- 48 Bellevue Rd
- 212 Humphrey St Unit 205
- 12 Pickwick Rd
- 4 Dean Rd
- 25 Tedesco St
- 37 Stanley Rd
- 11 Angenica Terrace
- 2 Ocean Ave
- 4 Gallison Ave
- 282 Pleasant St
- 24 Alden Rd
- 35 Alden Rd
- 1002 Paradise Rd Unit PHE
- 6 Loring Hills Ave Unit D3
- 70 Maverick St
- 23 Wyman Rd
- 34 Moffatt Rd
- 71 Walnut Rd
- 30 Haley Rd Unit 1
- 110 Galloupes Point Rd
Your Personal Tour Guide
Ask me questions while you tour the home.