Estimated Value: $238,000 - $341,000
4
Beds
1
Bath
1,664
Sq Ft
$173/Sq Ft
Est. Value
About This Home
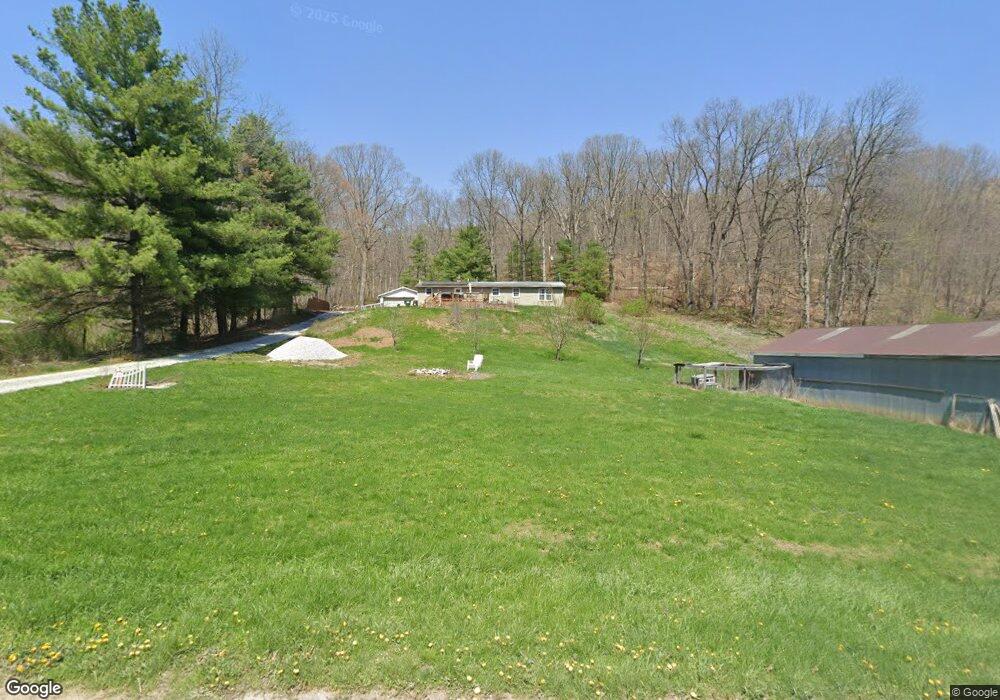
This home is located at 435 Back Run Rd, Philo, OH 43771 and is currently estimated at $287,924, approximately $173 per square foot. 435 Back Run Rd is a home located in Muskingum County with nearby schools including Philo High School.
Ownership History
Date
Name
Owned For
Owner Type
Purchase Details
Closed on
Aug 31, 2018
Sold by
Maurer Troy E and Maurer Lisa R
Bought by
Hall Stephen
Current Estimated Value
Home Financials for this Owner
Home Financials are based on the most recent Mortgage that was taken out on this home.
Original Mortgage
$122,052
Outstanding Balance
$106,217
Interest Rate
4.5%
Mortgage Type
VA
Estimated Equity
$181,707
Purchase Details
Closed on
Jul 25, 2007
Sold by
Maurer Shannon W
Bought by
Maurer Troy E
Purchase Details
Closed on
Aug 8, 2001
Sold by
Wheeler Raymond L
Bought by
Maurer Troy E
Home Financials for this Owner
Home Financials are based on the most recent Mortgage that was taken out on this home.
Original Mortgage
$91,451
Interest Rate
7.15%
Mortgage Type
FHA
Purchase Details
Closed on
Jun 27, 1997
Sold by
Thompson Ralph W
Bought by
Wheeler Raymond L and Wheeler Darylene E
Home Financials for this Owner
Home Financials are based on the most recent Mortgage that was taken out on this home.
Original Mortgage
$36,000
Interest Rate
8%
Mortgage Type
New Conventional
Create a Home Valuation Report for This Property
The Home Valuation Report is an in-depth analysis detailing your home's value as well as a comparison with similar homes in the area
Home Values in the Area
Average Home Value in this Area
Purchase History
| Date | Buyer | Sale Price | Title Company |
|---|---|---|---|
| Hall Stephen | $120,000 | None Available | |
| Maurer Troy E | -- | Attorney | |
| Maurer Troy E | $92,900 | -- | |
| Wheeler Raymond L | $64,000 | -- |
Source: Public Records
Mortgage History
| Date | Status | Borrower | Loan Amount |
|---|---|---|---|
| Open | Hall Stephen | $122,052 | |
| Previous Owner | Maurer Troy E | $91,451 | |
| Previous Owner | Wheeler Raymond L | $36,000 |
Source: Public Records
Tax History Compared to Growth
Tax History
| Year | Tax Paid | Tax Assessment Tax Assessment Total Assessment is a certain percentage of the fair market value that is determined by local assessors to be the total taxable value of land and additions on the property. | Land | Improvement |
|---|---|---|---|---|
| 2024 | $1,491 | $44,275 | $4,725 | $39,550 |
| 2023 | $1,023 | $27,965 | $3,605 | $24,360 |
| 2022 | $1,000 | $27,965 | $3,605 | $24,360 |
| 2021 | $986 | $27,965 | $3,605 | $24,360 |
| 2020 | $883 | $24,325 | $3,150 | $21,175 |
| 2019 | $881 | $24,325 | $3,150 | $21,175 |
| 2018 | $850 | $22,435 | $3,150 | $19,285 |
| 2017 | $837 | $21,105 | $2,800 | $18,305 |
| 2016 | $851 | $21,700 | $2,800 | $18,900 |
| 2015 | $871 | $21,700 | $2,800 | $18,900 |
| 2013 | $849 | $21,110 | $2,800 | $18,310 |
Source: Public Records
Map
Nearby Homes
- 845 Back Run Rd
- 280 Virginia Ridge Rd
- 8285 Old River Rd
- 7979 Old River Rd
- 9390 Shady Ln
- 7515 Pioneer Dr
- 1285 Moody Hollow Rd
- 0 Shaver Rd Unit 225044351
- 10115 Old River Rd
- 10112 S River Rd NW
- 426 Main St
- 431 Front St
- 252 Front St
- 142 Main St
- 135 Front St
- 2400 Irish Ridge Rd
- 6800 Center Rd
- 385 Water St
- 243 Mill St
- 310 Elm St
- 455 Back Run Rd
- 465 Back Run Rd
- 460 Back Run Rd
- 414 Back Run Rd
- 485 Back Run Rd
- 8201 Silvey Hollow Rd
- 840 Back Run Rd
- 635 Virginia Ridge Rd
- 7840 Silvey Hollow Rd
- 0 Back Run Rd Unit 5086387
- 0 Back Run Rd Unit (Tract 2 Hawk Nest C
- 0 Back Run Rd Unit (Tract 4 Hawk Cabin)
- 0 Back Run Rd Unit (Tract 4) 223023857
- 0 Back Run Rd Unit (Tract 3) 223023853
- 0 Back Run Rd Unit (Tract 2) 223023844
- 0 Back Run Rd Unit (Tract 1)
- 600 Virginia Ridge Rd
- 8200 Silvey Hollow Rd
- 520 Virginia Ridge Rd
- 600 Locksmith Ln