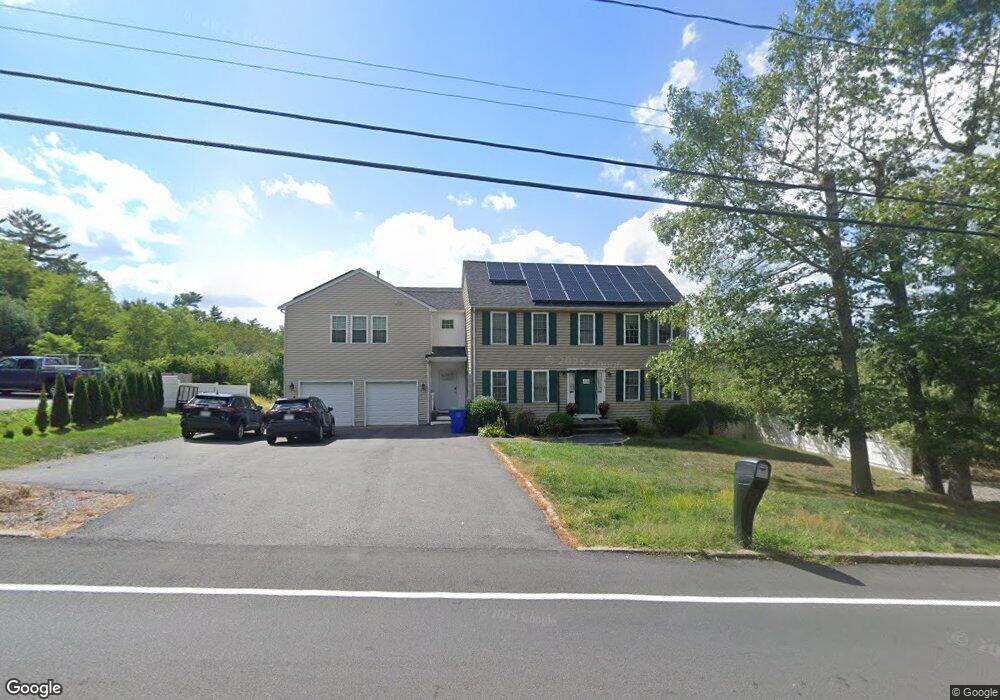
435 Beech St Rockland, MA 02370
Estimated Value: $730,000 - $787,000
4
Beds
4
Baths
2,468
Sq Ft
$304/Sq Ft
Est. Value
About This Home
This home is located at 435 Beech St, Rockland, MA 02370 and is currently estimated at $750,978, approximately $304 per square foot. 435 Beech St is a home located in Plymouth County with nearby schools including Rockland Senior High School, Calvary Chapel Academy, and St Bridget School.
Ownership History
Date
Name
Owned For
Owner Type
Purchase Details
Closed on
May 28, 2009
Sold by
Ndungu Virginia W
Bought by
Ndungu Milka G
Current Estimated Value
Home Financials for this Owner
Home Financials are based on the most recent Mortgage that was taken out on this home.
Original Mortgage
$296,000
Outstanding Balance
$188,023
Interest Rate
4.87%
Mortgage Type
Purchase Money Mortgage
Estimated Equity
$562,955
Purchase Details
Closed on
May 27, 2005
Sold by
Tinlin Matthew J and Tinlin Jean M
Bought by
Ndungu Virginia W and Ndungu Milka G
Home Financials for this Owner
Home Financials are based on the most recent Mortgage that was taken out on this home.
Original Mortgage
$308,750
Interest Rate
5.94%
Mortgage Type
Purchase Money Mortgage
Purchase Details
Closed on
Jun 30, 2000
Sold by
Macintire Paul
Bought by
Tinlin Matthew J and Tinlin Jean M
Home Financials for this Owner
Home Financials are based on the most recent Mortgage that was taken out on this home.
Original Mortgage
$175,000
Interest Rate
8.59%
Mortgage Type
Purchase Money Mortgage
Purchase Details
Closed on
Jan 5, 1999
Sold by
Plymouth Country Land and Hastings Thomas J
Bought by
Macintire Paul
Create a Home Valuation Report for This Property
The Home Valuation Report is an in-depth analysis detailing your home's value as well as a comparison with similar homes in the area
Home Values in the Area
Average Home Value in this Area
Purchase History
| Date | Buyer | Sale Price | Title Company |
|---|---|---|---|
| Ndungu Milka G | -- | -- | |
| Ndungu Virginia W | $325,000 | -- | |
| Tinlin Matthew J | $216,241 | -- | |
| Macintire Paul | $140,000 | -- |
Source: Public Records
Mortgage History
| Date | Status | Borrower | Loan Amount |
|---|---|---|---|
| Open | Macintire Paul | $296,000 | |
| Previous Owner | Macintire Paul | $308,750 | |
| Previous Owner | Macintire Paul | $180,000 | |
| Previous Owner | Macintire Paul | $175,000 |
Source: Public Records
Tax History Compared to Growth
Tax History
| Year | Tax Paid | Tax Assessment Tax Assessment Total Assessment is a certain percentage of the fair market value that is determined by local assessors to be the total taxable value of land and additions on the property. | Land | Improvement |
|---|---|---|---|---|
| 2025 | $9,635 | $704,800 | $222,700 | $482,100 |
| 2024 | $9,431 | $670,800 | $210,100 | $460,700 |
| 2023 | $9,607 | $631,200 | $202,900 | $428,300 |
| 2022 | $9,281 | $554,100 | $176,400 | $377,700 |
| 2021 | $7,276 | $509,100 | $160,300 | $348,800 |
| 2020 | $8,558 | $489,000 | $152,700 | $336,300 |
| 2019 | $7,243 | $360,300 | $145,500 | $214,800 |
| 2018 | $8,044 | $339,600 | $145,500 | $194,100 |
| 2017 | $9,773 | $315,100 | $145,500 | $169,600 |
| 2016 | $5,641 | $305,100 | $139,900 | $165,200 |
| 2015 | $5,378 | $282,600 | $130,700 | $151,900 |
| 2014 | $5,115 | $278,900 | $128,200 | $150,700 |
Source: Public Records
Map
Nearby Homes
- 60 Fairview St
- 10 Birch Bottom Cir
- 177 Jean Carol Rd
- 55 Plymouth St Unit A5
- 137 Peregrine Rd
- 522 Summer St
- 100 Litchfield Ln
- 228 Summer St
- 679 Plymouth St
- 40 Lazel St
- 23 Reed Place
- 18 Pat Rose Way
- 12 Hayford Trail Unit 17
- 5 Hayford Trail Unit 11
- 7 Hayford Trail Unit 12
- 13 Hayford Trail Unit 15
- 15 Hayford Trail Unit 16
- 696 Summer St
- 20 Pat Rose Way
- 22 Howland Trail Unit 34