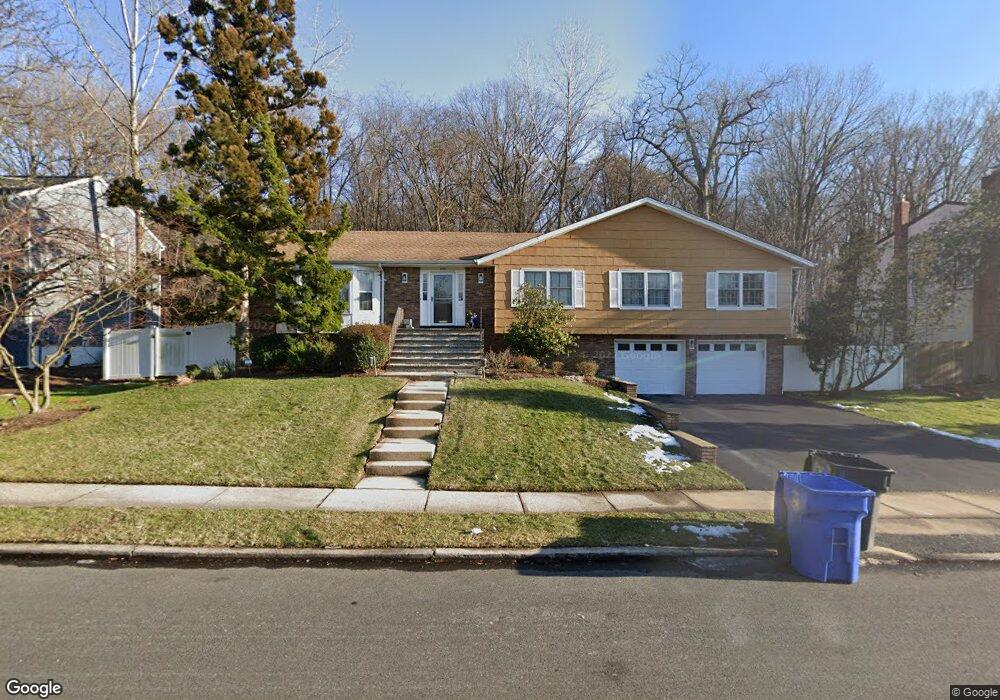
435 Cape May St Englewood, NJ 07631
Estimated Value: $877,000 - $1,225,000
--
Bed
--
Bath
2,312
Sq Ft
$469/Sq Ft
Est. Value
About This Home
This home is located at 435 Cape May St, Englewood, NJ 07631 and is currently estimated at $1,085,086, approximately $469 per square foot. 435 Cape May St is a home located in Bergen County with nearby schools including Dr J Grieco Elementary School, Dr Mccloud Elementary School, and J.E. Dismus Middle School.
Ownership History
Date
Name
Owned For
Owner Type
Purchase Details
Closed on
Sep 28, 2017
Sold by
Natali J Kaufman T and Jiltzik Tr Linda K
Bought by
Meir Daniel and Rabinowitz Elizabeth
Current Estimated Value
Home Financials for this Owner
Home Financials are based on the most recent Mortgage that was taken out on this home.
Original Mortgage
$460,000
Interest Rate
3.82%
Mortgage Type
Purchase Money Mortgage
Purchase Details
Closed on
Jun 29, 2012
Sold by
Hiltzik Linda K
Bought by
Hiltzik Linda K and Natalie J Kaufman Trust
Create a Home Valuation Report for This Property
The Home Valuation Report is an in-depth analysis detailing your home's value as well as a comparison with similar homes in the area
Home Values in the Area
Average Home Value in this Area
Purchase History
| Date | Buyer | Sale Price | Title Company |
|---|---|---|---|
| Meir Daniel | $575,000 | -- | |
| Hiltzik Linda K | -- | -- |
Source: Public Records
Mortgage History
| Date | Status | Borrower | Loan Amount |
|---|---|---|---|
| Previous Owner | Meir Daniel | $460,000 |
Source: Public Records
Tax History Compared to Growth
Tax History
| Year | Tax Paid | Tax Assessment Tax Assessment Total Assessment is a certain percentage of the fair market value that is determined by local assessors to be the total taxable value of land and additions on the property. | Land | Improvement |
|---|---|---|---|---|
| 2025 | $19,206 | $635,500 | $412,000 | $223,500 |
| 2024 | $18,625 | $625,000 | $412,000 | $213,000 |
| 2023 | $18,431 | $625,000 | $412,000 | $213,000 |
| 2022 | $18,431 | $625,000 | $412,000 | $213,000 |
| 2021 | $18,063 | $625,000 | $412,000 | $213,000 |
| 2020 | $17,594 | $625,000 | $412,000 | $213,000 |
| 2019 | $17,431 | $625,000 | $412,000 | $213,000 |
| 2018 | $19,106 | $701,900 | $412,000 | $289,900 |
| 2017 | $18,537 | $701,900 | $412,000 | $289,900 |
| 2016 | $17,948 | $701,900 | $412,000 | $289,900 |
| 2015 | $17,793 | $701,900 | $412,000 | $289,900 |
| 2014 | $17,646 | $701,900 | $412,000 | $289,900 |
Source: Public Records
Map
Nearby Homes
- 300 Van Nostrand Ave
- 505 Adele Ct
- 290 Van Nostrand Ave
- 12 Summit St
- 87 Irving Ave
- 18 Mallard Ct
- 14 Mallard Ct Unit 105
- 66 Elm St
- 9 Pheasant Run Unit 137
- 52 Birch St
- 184 Jenkins Dr
- 229 Allison Ct
- 470 Myrtle Ave
- 636 Jones Rd
- 14 Regency Cir Unit 14
- 306 Hutchinson Rd
- 56 Fox Run Dr
- 285 Arch Rd
- 26 Sara Hill Ln
- 424 Myrtle Ave
- 445 Cape May St
- 429 Cape May St
- 436 Cape May St
- 446 Cape May St
- 394 Van Nostrand Ave
- 453 Cape May St
- 454 Cape May St
- 437 Cumberland St
- 380 Van Nostrand Ave
- 445 Cumberland St
- 386 Van Nostrand Ave
- 463 Cape May St
- 453 Cumberland St
- 462 Cape May St
- 411 Cumberland St
- 461 Cumberland St
- 473 Cape May St
- 470 Cape May St
- 438 Cumberland St
- 473 Cumberland St