
Landlord's Agent in 2023
Judy Chin
Virtual Properties Realty.com
(770) 864-4362
12 in this area
107 Total Sales
Estimated Value: $556,000 - $654,000
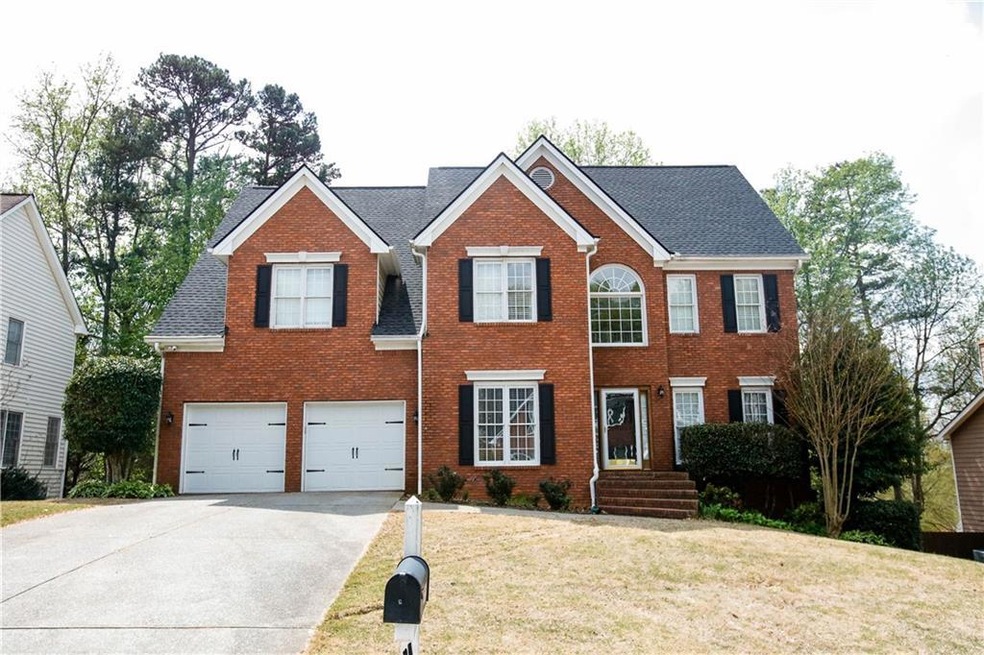
This beautiful home located in the highly desirable North Gwinnett high school district offers plenty of natural light and hardwood floors, a modern open kitchen with stainless steel appliances and an ample laundry room. The garage provides generous space while the covered porch sunroom is perfect for relaxing on sunny days. An expansive basement awaits - convert it into your own personal recreation area or even another bedroom!
Last Agent to Rent the Property
Virtual Properties Realty.com License #164703 Listed on: 04/05/2023
| Date | Buyer | Sale Price | Title Company |
|---|---|---|---|
| Tang Hui Xin | -- | -- | |
| Tang Hui Xin | $561,500 | -- | |
| Eye Tracy | $69,500 | -- | |
| Eye Tracy | $285,000 | -- | |
| Rodgers Andrew S | -- | -- | |
| Rao John | $163,500 | -- |
| Date | Status | Borrower | Loan Amount |
|---|---|---|---|
| Open | Tang Hui Xin | $364,975 | |
| Previous Owner | Eye Tracy | $297,000 | |
| Previous Owner | Eye Tracy | $256,500 | |
| Closed | Rao John | $0 |
| Date | Event | Price | List to Sale | Price per Sq Ft | Prior Sale |
|---|---|---|---|---|---|
| 04/27/2023 04/27/23 | Rented | $3,000 | 0.0% | -- | |
| 04/12/2023 04/12/23 | Under Contract | -- | -- | -- | |
| 04/05/2023 04/05/23 | For Rent | $3,000 | 0.0% | -- | |
| 03/28/2023 03/28/23 | Sold | $561,500 | -2.3% | $184 / Sq Ft | View Prior Sale |
| 02/23/2023 02/23/23 | Pending | -- | -- | -- | |
| 02/16/2023 02/16/23 | Price Changed | $574,900 | -4.2% | $189 / Sq Ft | |
| 02/02/2023 02/02/23 | For Sale | $600,000 | +110.5% | $197 / Sq Ft | |
| 09/25/2015 09/25/15 | Sold | $285,000 | 0.0% | $64 / Sq Ft | View Prior Sale |
| 08/18/2015 08/18/15 | Pending | -- | -- | -- | |
| 08/07/2015 08/07/15 | Price Changed | $285,000 | -1.7% | $64 / Sq Ft | |
| 07/17/2015 07/17/15 | Price Changed | $289,900 | -0.7% | $65 / Sq Ft | |
| 07/10/2015 07/10/15 | Price Changed | $292,000 | -1.0% | $66 / Sq Ft | |
| 06/16/2015 06/16/15 | Price Changed | $295,000 | -4.8% | $67 / Sq Ft | |
| 06/04/2015 06/04/15 | For Sale | $310,000 | -- | $70 / Sq Ft |
| Year | Tax Paid | Tax Assessment Tax Assessment Total Assessment is a certain percentage of the fair market value that is determined by local assessors to be the total taxable value of land and additions on the property. | Land | Improvement |
|---|---|---|---|---|
| 2025 | $914 | $250,720 | $38,000 | $212,720 |
| 2024 | $7,839 | $224,600 | $37,600 | $187,000 |
| 2023 | $7,839 | $259,520 | $37,600 | $221,920 |
| 2022 | $3,931 | $134,000 | $23,880 | $110,120 |
| 2021 | $4,023 | $134,000 | $23,880 | $110,120 |
| 2020 | $4,513 | $153,880 | $23,880 | $130,000 |
| 2019 | $4,979 | $153,880 | $23,880 | $130,000 |
| 2018 | $4,517 | $134,920 | $22,560 | $112,360 |
| 2016 | $3,984 | $114,000 | $27,200 | $86,800 |
| 2015 | $3,372 | $96,280 | $20,000 | $76,280 |
| 2014 | -- | $93,040 | $16,000 | $77,040 |
Landlord's Agent in 2023
Judy Chin
Virtual Properties Realty.com
(770) 864-4362
12 in this area
107 Total Sales
Seller's Agent in 2023
Shannon Marciano
Marciano & Company Real Estate
(770) 714-0151
2 in this area
119 Total Sales
R
Tenant's Agent in 2023
Ricki Shaw
Keller Williams Realty Atlanta Partners
(213) 926-6783
3 in this area
26 Total Sales
Seller's Agent in 2015
Rhonda Duffy
Duffy Realty of Atlanta
(678) 318-3613
25 in this area
1,490 Total Sales
Buyer's Agent in 2015
MIKE BEERNINK
Virtual Properties Realty.com
(770) 265-8580
2 in this area
84 Total Sales
Source: First Multiple Listing Service (FMLS)
MLS Number: 7198733
APN: 7-275-194
Disclaimer: Certain information contained herein is derived from information provided by parties other than Homes.com. All information provided is deemed reliable, but is not guaranteed to be accurate and should be independently verified.
![]() Listings identified with the FMLS IDX logo come from FMLS and are held by brokerage firms other than the owner of this website. The listing brokerage is identified in any listing details. Information is deemed reliable but is not guaranteed. If you believe any FMLS listing contains material that infringes your copyrighted work please visit www.fmls.com/dmca to review our DMCA policy and learn how to submit a takedown request. © 2025 First Multiple Listing Service, Inc.
Listings identified with the FMLS IDX logo come from FMLS and are held by brokerage firms other than the owner of this website. The listing brokerage is identified in any listing details. Information is deemed reliable but is not guaranteed. If you believe any FMLS listing contains material that infringes your copyrighted work please visit www.fmls.com/dmca to review our DMCA policy and learn how to submit a takedown request. © 2025 First Multiple Listing Service, Inc.