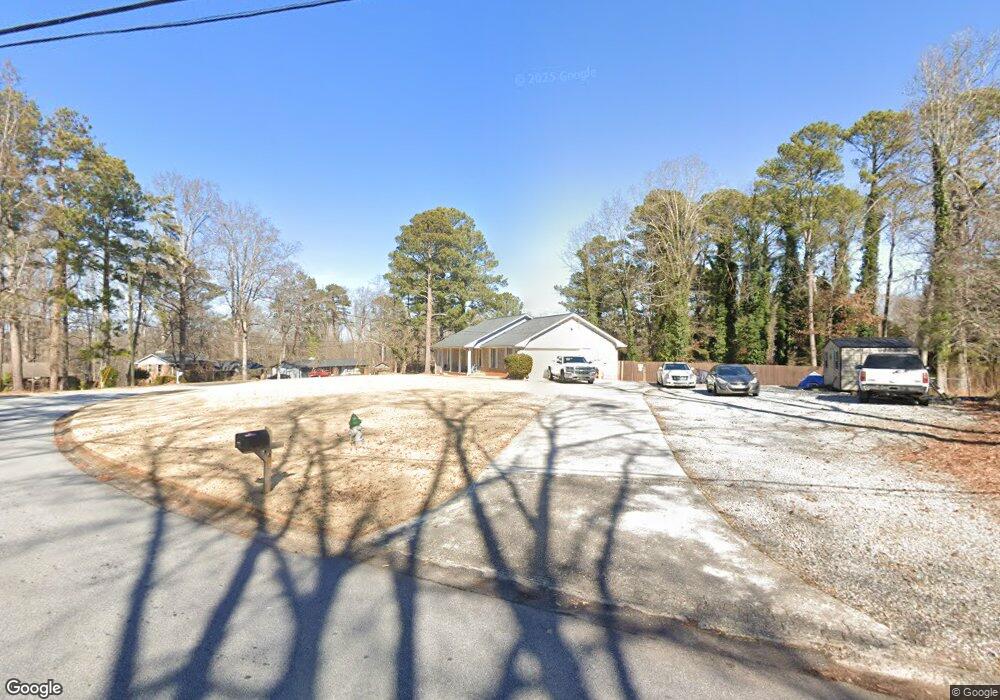
435 Cherokee Ridge Athens, GA 30606
Estimated Value: $263,886 - $325,000
3
Beds
2
Baths
1,596
Sq Ft
$187/Sq Ft
Est. Value
About This Home
This home is located at 435 Cherokee Ridge, Athens, GA 30606 and is currently estimated at $298,472, approximately $187 per square foot. 435 Cherokee Ridge is a home located in Clarke County with nearby schools including Cleveland Road Elementary School, Burney-Harris-Lyons Middle School, and Clarke Central High School.
Ownership History
Date
Name
Owned For
Owner Type
Purchase Details
Closed on
Nov 30, 2010
Sold by
Williamson Sam
Bought by
King Linn
Current Estimated Value
Home Financials for this Owner
Home Financials are based on the most recent Mortgage that was taken out on this home.
Original Mortgage
$116,037
Outstanding Balance
$76,181
Interest Rate
4.25%
Mortgage Type
FHA
Estimated Equity
$222,291
Purchase Details
Closed on
Aug 8, 2008
Sold by
Lee John S
Bought by
Williamson Sam
Purchase Details
Closed on
Feb 10, 1999
Sold by
Henderson Deborah M
Bought by
Henderson Deborah M and Henderson John S
Purchase Details
Closed on
Dec 30, 1992
Sold by
Henderson Albert R and Henderson Aura R
Bought by
Henderson Aura R and Deborah Henderso
Purchase Details
Closed on
Sep 4, 1992
Sold by
Henderson Aura R & Deborah Henderson By
Bought by
Henderson Deborah M
Purchase Details
Closed on
Jun 1, 1989
Sold by
Vanorman William D
Bought by
Henderson Albert R and Henderson Aura R
Create a Home Valuation Report for This Property
The Home Valuation Report is an in-depth analysis detailing your home's value as well as a comparison with similar homes in the area
Home Values in the Area
Average Home Value in this Area
Purchase History
| Date | Buyer | Sale Price | Title Company |
|---|---|---|---|
| King Linn | $117,600 | -- | |
| Williamson Sam | $100,000 | -- | |
| Henderson Deborah M | -- | -- | |
| Henderson Aura R | -- | -- | |
| Henderson Deborah M | -- | -- | |
| Henderson Albert R | $69,000 | -- |
Source: Public Records
Mortgage History
| Date | Status | Borrower | Loan Amount |
|---|---|---|---|
| Open | King Linn | $116,037 |
Source: Public Records
Tax History Compared to Growth
Tax History
| Year | Tax Paid | Tax Assessment Tax Assessment Total Assessment is a certain percentage of the fair market value that is determined by local assessors to be the total taxable value of land and additions on the property. | Land | Improvement |
|---|---|---|---|---|
| 2025 | $2,075 | $92,613 | $12,000 | $80,613 |
| 2024 | $2,075 | $82,730 | $12,000 | $70,730 |
| 2023 | $1,284 | $76,082 | $12,000 | $64,082 |
| 2022 | $1,680 | $62,659 | $10,400 | $52,259 |
| 2021 | $1,501 | $54,549 | $10,400 | $44,149 |
| 2020 | $1,434 | $52,545 | $10,400 | $42,145 |
| 2019 | $1,311 | $48,619 | $9,600 | $39,019 |
| 2018 | $1,203 | $45,445 | $9,600 | $35,845 |
| 2017 | $1,110 | $42,701 | $9,600 | $33,101 |
| 2016 | $1,021 | $40,062 | $9,600 | $30,462 |
| 2015 | $1,053 | $40,945 | $9,600 | $31,345 |
| 2014 | $1,076 | $41,573 | $9,600 | $31,973 |
Source: Public Records
Map
Nearby Homes
- 212 Huntington Shoals Dr
- 141 Huntington Shoals Dr
- 256 Cherokee Ridge
- 532 Huntington Rd Unit 7
- 240 W Huntington Rd
- 470 Huntington Rd Unit 5
- 637 Huntington Rd Unit B1
- 190 W Huntington Rd
- 682 Chesterfield Rd
- 450 River Bottom Rd
- 241 Meeler Cir
- 575 Vaughn Rd
- 115 Woodhaven St
- 212 Meeler Cir
- 184 Hillsborough Dr
- 170 Huntington Ct
- 164 Lucy Ln
- 455 Cherokee Ridge
- 405 Cherokee Ridge
- 465 Cherokee Ridge
- 420 Cherokee Ridge
- 410 Cherokee Ridge
- 440 Cherokee Ridge
- 430 Cherokee Ridge
- 385 Cherokee Ridge
- 450 Cherokee Ridge
- 367 Cherokee Ridge
- 400 Cherokee Ridge
- 361 Cherokee Ridge
- 473 Cherokee Ridge
- 398 Cherokee Ridge
- 470 Cherokee Ridge
- 351 Cherokee Ridge
- 220 Huntington Shoals Dr
- 345 Cherokee Ridge
- 390 Cherokee Ridge