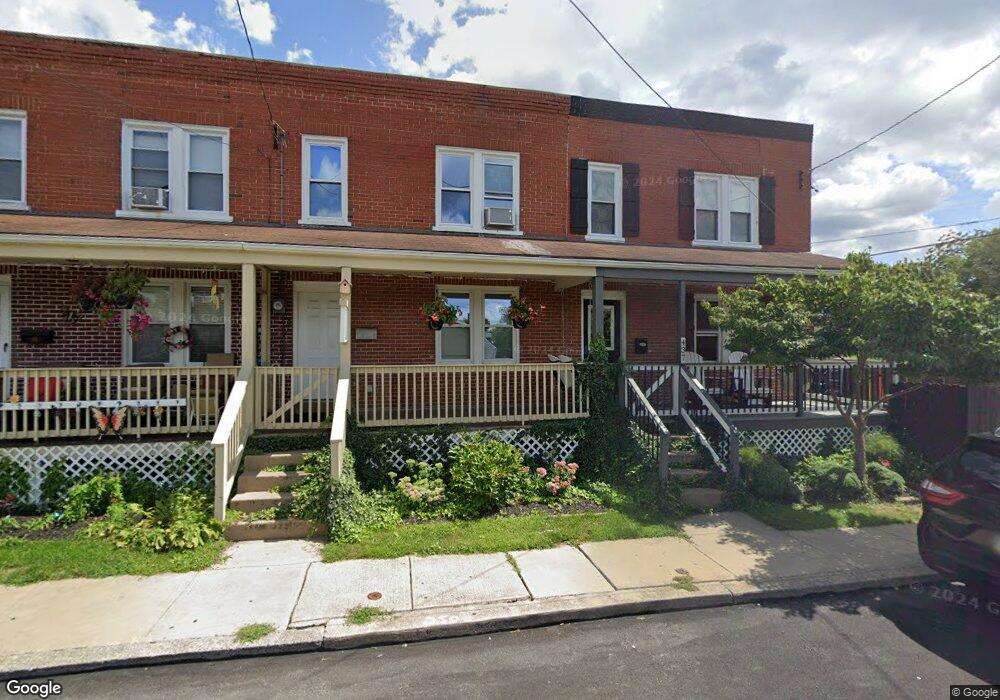
435 Chester St Lancaster, PA 17602
Churchtowne NeighborhoodEstimated Value: $116,000 - $166,000
3
Beds
1
Bath
1,064
Sq Ft
$129/Sq Ft
Est. Value
About This Home
This home is located at 435 Chester St, Lancaster, PA 17602 and is currently estimated at $137,136, approximately $128 per square foot. 435 Chester St is a home located in Lancaster County with nearby schools including Carter & MacRae Elementary School, Reynolds Middle School, and McCaskey High School.
Ownership History
Date
Name
Owned For
Owner Type
Purchase Details
Closed on
Nov 14, 2025
Sold by
Heart To Heart Ministries
Bought by
Hurst Joel H and Hurst Melanie R
Current Estimated Value
Home Financials for this Owner
Home Financials are based on the most recent Mortgage that was taken out on this home.
Original Mortgage
$110,800
Outstanding Balance
$110,800
Interest Rate
6.3%
Mortgage Type
New Conventional
Estimated Equity
$26,336
Purchase Details
Closed on
Sep 14, 2017
Sold by
Poole Forge Properties
Bought by
Martin David B and Burkholder Kenneth N
Purchase Details
Closed on
Dec 2, 2010
Sold by
Gearhart Ryan L
Bought by
Poole Forge Properties
Purchase Details
Closed on
May 19, 2006
Sold by
Cerquozzi Antonio H
Bought by
Gearhart Ryan L
Purchase Details
Closed on
Jul 9, 1999
Sold by
Wright Edgar M
Bought by
Cequozzi Antonio H
Home Financials for this Owner
Home Financials are based on the most recent Mortgage that was taken out on this home.
Original Mortgage
$43,050
Interest Rate
7.39%
Create a Home Valuation Report for This Property
The Home Valuation Report is an in-depth analysis detailing your home's value as well as a comparison with similar homes in the area
Home Values in the Area
Average Home Value in this Area
Purchase History
| Date | Buyer | Sale Price | Title Company |
|---|---|---|---|
| Hurst Joel H | $138,500 | Premier Home Settlements | |
| Martin David B | -- | None Available | |
| Poole Forge Properties | $36,000 | None Available | |
| Gearhart Ryan L | $25,000 | None Available | |
| Cequozzi Antonio H | $28,000 | Lawyers Title Insurance Corp |
Source: Public Records
Mortgage History
| Date | Status | Borrower | Loan Amount |
|---|---|---|---|
| Open | Hurst Joel H | $110,800 | |
| Previous Owner | Cequozzi Antonio H | $43,050 |
Source: Public Records
Tax History Compared to Growth
Tax History
| Year | Tax Paid | Tax Assessment Tax Assessment Total Assessment is a certain percentage of the fair market value that is determined by local assessors to be the total taxable value of land and additions on the property. | Land | Improvement |
|---|---|---|---|---|
| 2025 | $1,543 | $39,000 | $6,800 | $32,200 |
| 2024 | $1,543 | $39,000 | $6,800 | $32,200 |
| 2023 | $1,517 | $39,000 | $6,800 | $32,200 |
| 2022 | $1,454 | $39,000 | $6,800 | $32,200 |
| 2021 | $1,423 | $39,000 | $6,800 | $32,200 |
| 2020 | $1,423 | $39,000 | $6,800 | $32,200 |
| 2019 | $1,402 | $39,000 | $6,800 | $32,200 |
| 2018 | $832 | $39,000 | $6,800 | $32,200 |
| 2016 | $1,684 | $37,000 | $7,100 | $29,900 |
| 2015 | $657 | $37,000 | $7,100 | $29,900 |
| 2014 | $1,470 | $37,000 | $7,100 | $29,900 |
Source: Public Records
Map
Nearby Homes
- 462 S Christian St
- 520 S Duke St
- 507 Locust St
- 536 Woodward St
- 567 S Christian St
- 513 Howard Ave
- 518 Green St
- 555 Woodward St
- 530 S Lime St
- 14 E Farnum St
- 459 S Queen St
- 561 S Lime St
- 316 Beaver St
- 341 S Prince St
- 506 Beaver St
- 348 S Prince St
- 54 Green St
- 543 S Prince St
- 405 S Shippen St
- 641 S Queen St
- 437 Chester St
- 433 Chester St
- 515 S Christian St
- 431 Chester St
- 517 S Christian St
- 423 Chester St
- 519 S Christian St
- 521 S Christian St
- 421 Chester St
- 430 Green St
- 428 Green St
- 523 S Christian St
- 426 Green St
- 424 Green St
- 417 Chester St
- 525 S Christian St
- 422 Green St
- 415 Chester St
- 420 Green St
- 474 S Christian St