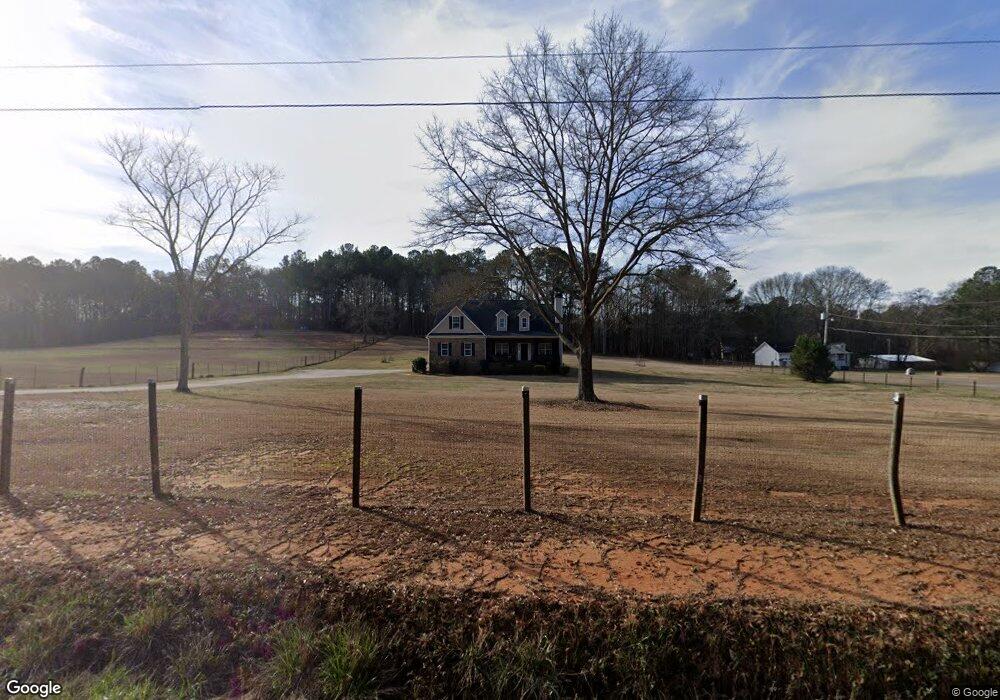
435 Duncan Rd Oxford, GA 30054
Estimated Value: $439,638 - $515,000
5
Beds
3
Baths
2,314
Sq Ft
$207/Sq Ft
Est. Value
About This Home
This home is located at 435 Duncan Rd, Oxford, GA 30054 and is currently estimated at $477,910, approximately $206 per square foot. 435 Duncan Rd is a home located in Newton County with nearby schools including Flint Hill Elementary School, Cousins Middle School, and Newton High School.
Ownership History
Date
Name
Owned For
Owner Type
Purchase Details
Closed on
Dec 11, 2009
Sold by
Federal Home Loan Mortgage Corporation
Bought by
Parker Russell G
Current Estimated Value
Home Financials for this Owner
Home Financials are based on the most recent Mortgage that was taken out on this home.
Original Mortgage
$176,970
Outstanding Balance
$116,080
Interest Rate
5.01%
Mortgage Type
New Conventional
Estimated Equity
$361,830
Purchase Details
Closed on
Aug 4, 2009
Sold by
Taylor Bean & Whitaker Mtg
Bought by
Federal Home Loan Mortgage Corporation
Purchase Details
Closed on
May 18, 2007
Sold by
Starkey Hm Bldrs Llc
Bought by
Zapata Ignacio
Home Financials for this Owner
Home Financials are based on the most recent Mortgage that was taken out on this home.
Original Mortgage
$219,200
Interest Rate
6.17%
Mortgage Type
New Conventional
Purchase Details
Closed on
Sep 8, 2006
Sold by
Rhodes Charles E and Rhodes Trudy L
Bought by
Starkey Stephen D
Home Financials for this Owner
Home Financials are based on the most recent Mortgage that was taken out on this home.
Original Mortgage
$216,000
Interest Rate
6.52%
Mortgage Type
Stand Alone Second
Create a Home Valuation Report for This Property
The Home Valuation Report is an in-depth analysis detailing your home's value as well as a comparison with similar homes in the area
Home Values in the Area
Average Home Value in this Area
Purchase History
| Date | Buyer | Sale Price | Title Company |
|---|---|---|---|
| Parker Russell G | -- | -- | |
| Federal Home Loan Mortgage Corporation | -- | -- | |
| Taylor Bean & Whitaker Mtg | $181,500 | -- | |
| Zapata Ignacio | $274,000 | -- | |
| Starkey Stephen D | $53,500 | -- |
Source: Public Records
Mortgage History
| Date | Status | Borrower | Loan Amount |
|---|---|---|---|
| Open | Parker Russell G | $176,970 | |
| Previous Owner | Zapata Ignacio | $219,200 | |
| Previous Owner | Starkey Stephen D | $216,000 |
Source: Public Records
Tax History Compared to Growth
Tax History
| Year | Tax Paid | Tax Assessment Tax Assessment Total Assessment is a certain percentage of the fair market value that is determined by local assessors to be the total taxable value of land and additions on the property. | Land | Improvement |
|---|---|---|---|---|
| 2024 | $4,222 | $170,520 | $16,000 | $154,520 |
| 2023 | $3,958 | $149,720 | $16,000 | $133,720 |
| 2022 | $3,286 | $124,960 | $7,400 | $117,560 |
| 2021 | $3,378 | $115,280 | $7,400 | $107,880 |
| 2020 | $2,956 | $91,880 | $9,560 | $82,320 |
| 2019 | $2,979 | $91,240 | $9,560 | $81,680 |
| 2018 | $2,646 | $80,960 | $9,560 | $71,400 |
| 2017 | $2,351 | $72,360 | $6,360 | $66,000 |
| 2016 | $2,114 | $65,480 | $6,360 | $59,120 |
| 2015 | $2,319 | $71,440 | $6,400 | $65,040 |
| 2014 | $2,313 | $71,440 | $0 | $0 |
Source: Public Records
Map
Nearby Homes
- 900 Stone Lea Trace
- 810 Northlake Cir
- 400 Stone Lea Trace
- 25 Clear Spring Ln Unit 2
- 50 Northwood Oak Dr
- 36 Duncan Rd
- 45 Northwood Oak Dr
- 200 Clear Spring Ln
- 520 W Lake Dr
- 110 Northwood Creek Way
- 70 Clear Spring Ct
- 50 Clear Spring Ct
- 625 W Lake Dr
- 0 Ellington Rd Unit 10609686
- 1220 Lake Stone Lea Dr
- 25 Clear Spring Ct
- 920 W Lake Dr
- 168 Jersey Rd
- 495 Duncan Rd
- 610 Northlake Cir Unit 3
- 570 Northlake Cir
- 405 Duncan Rd
- 200 N Northlake Cir
- 520 Northlake Cir
- 595 Northlake Cir
- 635 Northlake Cir
- 635 N Lake
- 397 Duncan Rd
- 555 Northlake Cir
- 595 Duncan Rd
- 420 Northlake Cir
- 730 Northlake Cir
- 515 Northlake Cir
- 745 Northlake Cir
- 370 Northlake Cir
- 745 N Lake Cir
- 317 Duncan Rd
- 317 Duncan Rd Unit 51