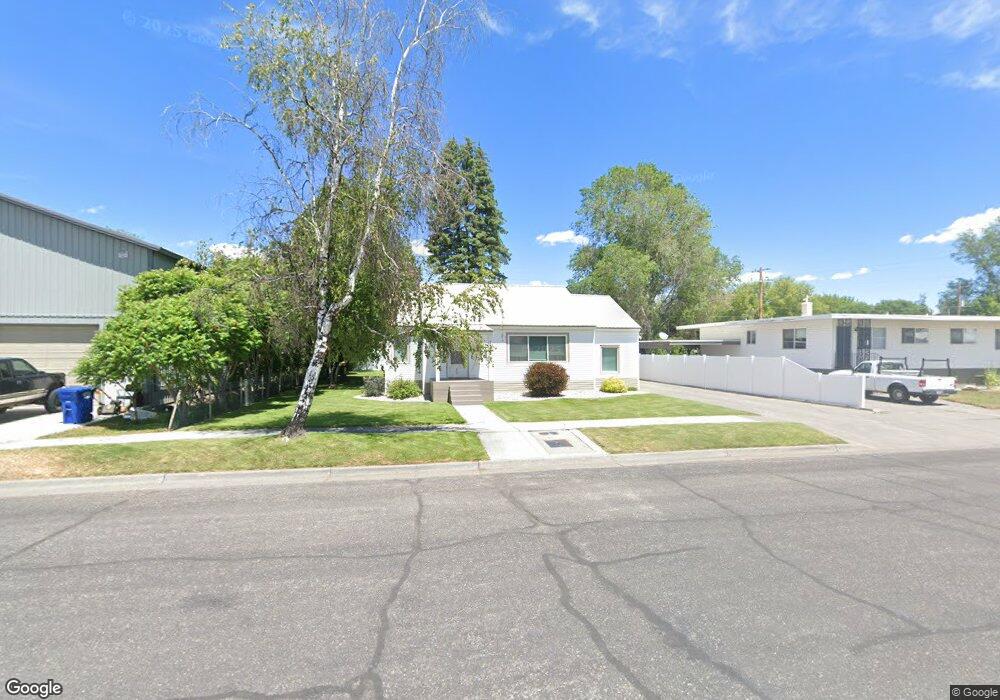
435 E 1st N Saint Anthony, ID 83445
Estimated Value: $280,000 - $334,000
3
Beds
2
Baths
1,964
Sq Ft
$156/Sq Ft
Est. Value
About This Home
This home is located at 435 E 1st N, Saint Anthony, ID 83445 and is currently estimated at $307,343, approximately $156 per square foot. 435 E 1st N is a home located in Fremont County with nearby schools including Henrys Fork Elementary School, South Fremont Junior High School, and South Fremont High School.
Ownership History
Date
Name
Owned For
Owner Type
Purchase Details
Closed on
May 28, 2014
Sold by
Young T Jay
Bought by
Walker Marty and Walker Leslie
Current Estimated Value
Home Financials for this Owner
Home Financials are based on the most recent Mortgage that was taken out on this home.
Original Mortgage
$98,000
Outstanding Balance
$29,196
Interest Rate
3.29%
Mortgage Type
New Conventional
Estimated Equity
$278,147
Purchase Details
Closed on
Jul 30, 2007
Sold by
Frome Faye C
Bought by
Young T Jay
Home Financials for this Owner
Home Financials are based on the most recent Mortgage that was taken out on this home.
Original Mortgage
$110,900
Interest Rate
6.73%
Mortgage Type
New Conventional
Create a Home Valuation Report for This Property
The Home Valuation Report is an in-depth analysis detailing your home's value as well as a comparison with similar homes in the area
Home Values in the Area
Average Home Value in this Area
Purchase History
| Date | Buyer | Sale Price | Title Company |
|---|---|---|---|
| Walker Marty | -- | First American Title | |
| Young T Jay | -- | -- |
Source: Public Records
Mortgage History
| Date | Status | Borrower | Loan Amount |
|---|---|---|---|
| Open | Walker Marty | $98,000 | |
| Closed | Walker Marty | $26,460 | |
| Previous Owner | Young T Jay | $110,900 |
Source: Public Records
Tax History
| Year | Tax Paid | Tax Assessment Tax Assessment Total Assessment is a certain percentage of the fair market value that is determined by local assessors to be the total taxable value of land and additions on the property. | Land | Improvement |
|---|---|---|---|---|
| 2025 | $960 | $110,419 | $25,781 | $84,638 |
| 2024 | $932 | $104,302 | $25,781 | $78,521 |
| 2023 | $888 | $104,302 | $25,781 | $78,521 |
| 2022 | $1,164 | $86,890 | $25,781 | $61,109 |
| 2021 | $1,211 | $71,923 | $21,094 | $50,829 |
| 2020 | $1,233 | $68,441 | $21,094 | $47,347 |
| 2019 | $1,227 | $68,441 | $21,094 | $47,347 |
| 2018 | $1,173 | $61,040 | $21,094 | $39,946 |
| 2017 | $12 | $50,711 | $20,461 | $30,250 |
| 2016 | $1,154 | $50,711 | $20,461 | $30,250 |
| 2015 | $1,139 | $101,427 | $0 | $0 |
| 2014 | $894 | $50,578 | $0 | $0 |
| 2013 | $894 | $50,578 | $0 | $0 |
Source: Public Records
Map
Nearby Homes
Your Personal Tour Guide
Ask me questions while you tour the home.