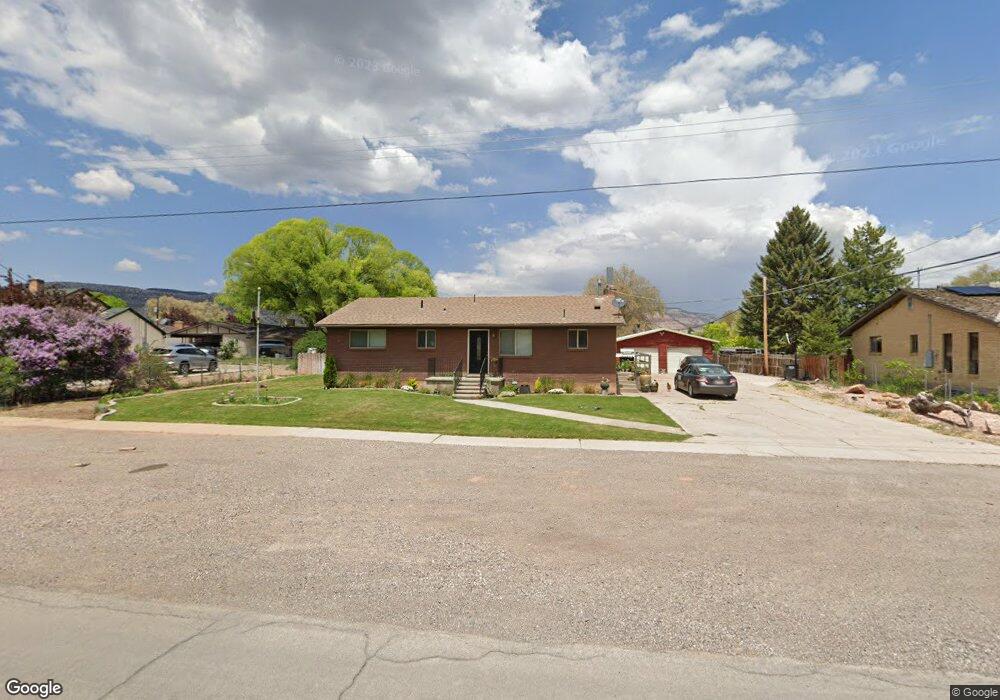
435 E 400 N Richfield, UT 84701
Estimated Value: $291,000 - $328,000
Studio
--
Bath
1,320
Sq Ft
$233/Sq Ft
Est. Value
About This Home
This home is located at 435 E 400 N, Richfield, UT 84701 and is currently estimated at $307,785, approximately $233 per square foot. 435 E 400 N is a home located in Sevier County with nearby schools including Pahvant School, Ashman School, and Red Hills Middle School.
Ownership History
Date
Name
Owned For
Owner Type
Purchase Details
Closed on
Dec 1, 2017
Sold by
Greenhalgh Bart R and Greenhalgh Troy
Bought by
George Karina and George Peter
Current Estimated Value
Home Financials for this Owner
Home Financials are based on the most recent Mortgage that was taken out on this home.
Original Mortgage
$8,500
Outstanding Balance
$5,872
Interest Rate
3.94%
Mortgage Type
Stand Alone Second
Estimated Equity
$301,913
Purchase Details
Closed on
Nov 2, 2007
Sold by
Greenhalgh Rolaine B and Blackham Rolaine B
Bought by
Greenhalgh Bart R and Greenhalgh Troy
Create a Home Valuation Report for This Property
The Home Valuation Report is an in-depth analysis detailing your home's value as well as a comparison with similar homes in the area
Purchase History
| Date | Buyer | Sale Price | Title Company |
|---|---|---|---|
| George Karina | -- | First American Title Insuran | |
| George Karina | -- | First American Title Insuran | |
| Greenhalgh Bart R | -- | None Available |
Source: Public Records
Mortgage History
| Date | Status | Borrower | Loan Amount |
|---|---|---|---|
| Open | George Karina | $8,500 | |
| Open | George Karina | $174,600 |
Source: Public Records
Tax History
| Year | Tax Paid | Tax Assessment Tax Assessment Total Assessment is a certain percentage of the fair market value that is determined by local assessors to be the total taxable value of land and additions on the property. | Land | Improvement |
|---|---|---|---|---|
| 2025 | $1,522 | $156,734 | $46,984 | $109,750 |
| 2024 | $1,522 | $166,004 | $37,793 | $128,211 |
| 2023 | $1,642 | $173,881 | $34,470 | $139,411 |
| 2022 | $1,608 | $146,820 | $30,434 | $116,386 |
| 2021 | $1,551 | $119,210 | $30,424 | $88,786 |
| 2020 | $1,395 | $104,192 | $23,344 | $80,848 |
| 2019 | $1,190 | $94,130 | $19,450 | $74,680 |
| 2018 | $1,189 | $84,270 | $19,450 | $64,820 |
| 2017 | $1,155 | $78,100 | $19,450 | $58,650 |
| 2016 | $951 | $78,100 | $0 | $0 |
| 2015 | $951 | $74,070 | $0 | $0 |
| 2014 | $951 | $70,790 | $0 | $0 |
Source: Public Records
Map
Nearby Homes
Your Personal Tour Guide
Ask me questions while you tour the home.