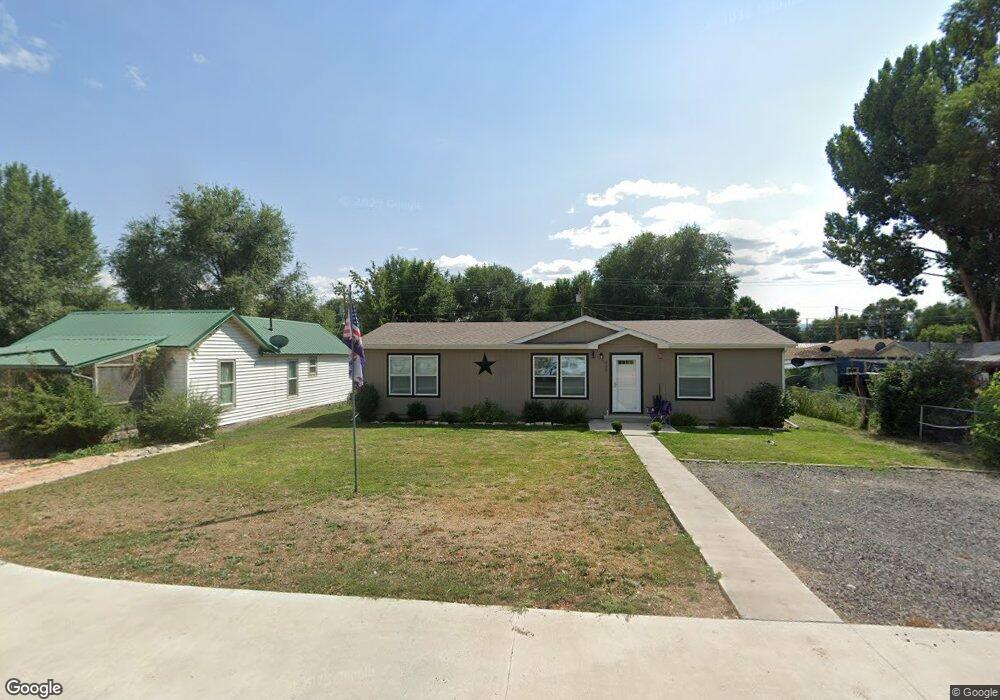
435 E Main St Hotchkiss, CO 81419
Estimated Value: $356,000 - $365,000
3
Beds
2
Baths
1,378
Sq Ft
$262/Sq Ft
Est. Value
About This Home
This home is located at 435 E Main St, Hotchkiss, CO 81419 and is currently estimated at $361,194, approximately $262 per square foot. 435 E Main St is a home located in Delta County with nearby schools including Hotchkiss Elementary School and North Fork High School.
Ownership History
Date
Name
Owned For
Owner Type
Purchase Details
Closed on
Jun 18, 2025
Sold by
Daugherty Stephen N and Daugherty Belinda P
Bought by
Simpson Jaden S and Galley Samantha D
Current Estimated Value
Home Financials for this Owner
Home Financials are based on the most recent Mortgage that was taken out on this home.
Original Mortgage
$358,585
Outstanding Balance
$357,655
Interest Rate
6.76%
Mortgage Type
New Conventional
Estimated Equity
$3,539
Purchase Details
Closed on
Aug 14, 2019
Sold by
Ator Adam and Ator Acacia
Bought by
Daugherty Stephen N and Daugherty Belinda P
Purchase Details
Closed on
Sep 14, 2018
Sold by
Ator Adam
Bought by
Ator Adam and Ator Acacia
Home Financials for this Owner
Home Financials are based on the most recent Mortgage that was taken out on this home.
Original Mortgage
$25,500
Interest Rate
4.6%
Mortgage Type
Commercial
Purchase Details
Closed on
Oct 3, 2014
Sold by
Vincent Connie L and Mackendrick Larry G
Bought by
Tribble Rodney K and Tribble Deborah M
Create a Home Valuation Report for This Property
The Home Valuation Report is an in-depth analysis detailing your home's value as well as a comparison with similar homes in the area
Home Values in the Area
Average Home Value in this Area
Purchase History
| Date | Buyer | Sale Price | Title Company |
|---|---|---|---|
| Simpson Jaden S | $355,000 | Land Title | |
| Daugherty Stephen N | $45,000 | None Available | |
| Ator Adam | -- | None Available | |
| Ator Adam | $34,000 | None Available | |
| Tribble Rodney K | $20,000 | None Available |
Source: Public Records
Mortgage History
| Date | Status | Borrower | Loan Amount |
|---|---|---|---|
| Open | Simpson Jaden S | $358,585 | |
| Previous Owner | Ator Adam | $25,500 |
Source: Public Records
Tax History Compared to Growth
Tax History
| Year | Tax Paid | Tax Assessment Tax Assessment Total Assessment is a certain percentage of the fair market value that is determined by local assessors to be the total taxable value of land and additions on the property. | Land | Improvement |
|---|---|---|---|---|
| 2024 | $1,264 | $16,648 | $2,085 | $14,563 |
| 2023 | $1,264 | $16,648 | $2,085 | $14,563 |
| 2022 | $1,016 | $13,692 | $2,433 | $11,259 |
| 2021 | $1,020 | $14,086 | $2,503 | $11,583 |
| 2020 | $205 | $2,795 | $2,646 | $149 |
| 2019 | $202 | $2,795 | $2,646 | $149 |
| 2018 | $206 | $2,751 | $2,664 | $87 |
| 2017 | $185 | $2,751 | $2,664 | $87 |
| 2016 | $159 | $2,454 | $2,388 | $66 |
| 2014 | -- | $6,362 | $2,866 | $3,496 |
Source: Public Records
Map
Nearby Homes
- 135 4th St
- 579 E Bridge St
- 461 Willow Dr
- 120 Pinion Dr
- 611 Cottonwood Ln
- 856 Short Rd
- TBD Powell Mesa Rd
- 33059 J Rd
- 11762 3550 Rd
- 32504 Highway 92
- 34797 Powell Mesa Rd
- TBD Mystic Mesa Rd
- 9845 3775 Rd
- 12216 Mystic Mesa Rd
- 9627 3200 Rd
- TBD 5 3400 Rd
- 3300 F50 Rd
- 36639 M50 Rd
- 36600 Walker Springs Rd
- no address J Rd
- 441 E Main St
- 181 4th St
- 430 E Bridge St
- 529 E Main St
- 410 E Bridge St
- 446 E Main St
- 133 4th St
- 235 4th St
- 379 E Main St
- 92 Highway 133
- 0 Tbd Juniper St Unit 764087
- 3450 Rd Powell Mesa Rd
- 0 John Boothe Rd Unit 618280
- 2nd Filing North Ridge Meadows
- 0 Lot 11 North Ridge Meadows Unit 624183
- 0 Cr J75 Road Tbd Unit 627718
- 0 Adobe Hills Estate Unit 677179
- 0 Adobe Hills Estate Unit 654543
- 0 Tbd 3100 Rd Unit 674554
- 0 Tbd 3100 Rd Unit 674552