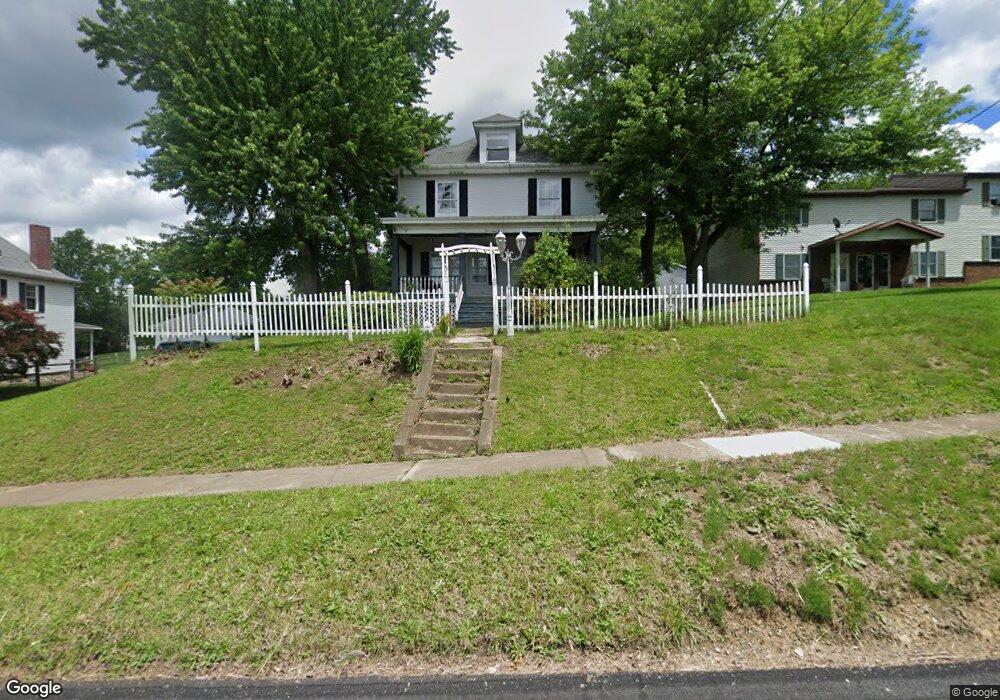
435 E Main St Uniontown, PA 15401
Estimated Value: $196,074 - $270,000
3
Beds
3
Baths
2,790
Sq Ft
$80/Sq Ft
Est. Value
About This Home
This home is located at 435 E Main St, Uniontown, PA 15401 and is currently estimated at $222,269, approximately $79 per square foot. 435 E Main St is a home located in Fayette County with nearby schools including Laurel Highlands Senior High School, St. John the Evangelist School, and Chestnut Ridge Christian Academy.
Ownership History
Date
Name
Owned For
Owner Type
Purchase Details
Closed on
Jan 24, 2014
Sold by
Hickey Sylvia L
Bought by
Myers Steven Brent and Myers Heather
Current Estimated Value
Home Financials for this Owner
Home Financials are based on the most recent Mortgage that was taken out on this home.
Original Mortgage
$166,742
Outstanding Balance
$124,542
Interest Rate
4.5%
Mortgage Type
FHA
Estimated Equity
$97,727
Create a Home Valuation Report for This Property
The Home Valuation Report is an in-depth analysis detailing your home's value as well as a comparison with similar homes in the area
Home Values in the Area
Average Home Value in this Area
Purchase History
| Date | Buyer | Sale Price | Title Company |
|---|---|---|---|
| Myers Steven Brent | $172,500 | None Available |
Source: Public Records
Mortgage History
| Date | Status | Borrower | Loan Amount |
|---|---|---|---|
| Open | Myers Steven Brent | $166,742 |
Source: Public Records
Tax History
| Year | Tax Paid | Tax Assessment Tax Assessment Total Assessment is a certain percentage of the fair market value that is determined by local assessors to be the total taxable value of land and additions on the property. | Land | Improvement |
|---|---|---|---|---|
| 2025 | $1,255 | $44,225 | $10,765 | $33,460 |
| 2024 | $1,220 | $44,225 | $10,765 | $33,460 |
| 2023 | $2,345 | $44,225 | $10,765 | $33,460 |
| 2022 | $2,323 | $44,225 | $10,765 | $33,460 |
| 2021 | $2,258 | $44,225 | $10,765 | $33,460 |
| 2020 | $2,258 | $44,225 | $10,765 | $33,460 |
| 2019 | $2,072 | $44,225 | $10,765 | $33,460 |
| 2018 | $2,009 | $44,225 | $10,765 | $33,460 |
| 2017 | $2,009 | $44,225 | $10,765 | $33,460 |
| 2016 | -- | $44,225 | $10,765 | $33,460 |
| 2015 | -- | $44,225 | $10,765 | $33,460 |
| 2014 | -- | $88,450 | $21,530 | $66,920 |
Source: Public Records
Map
Nearby Homes
Your Personal Tour Guide
Ask me questions while you tour the home.