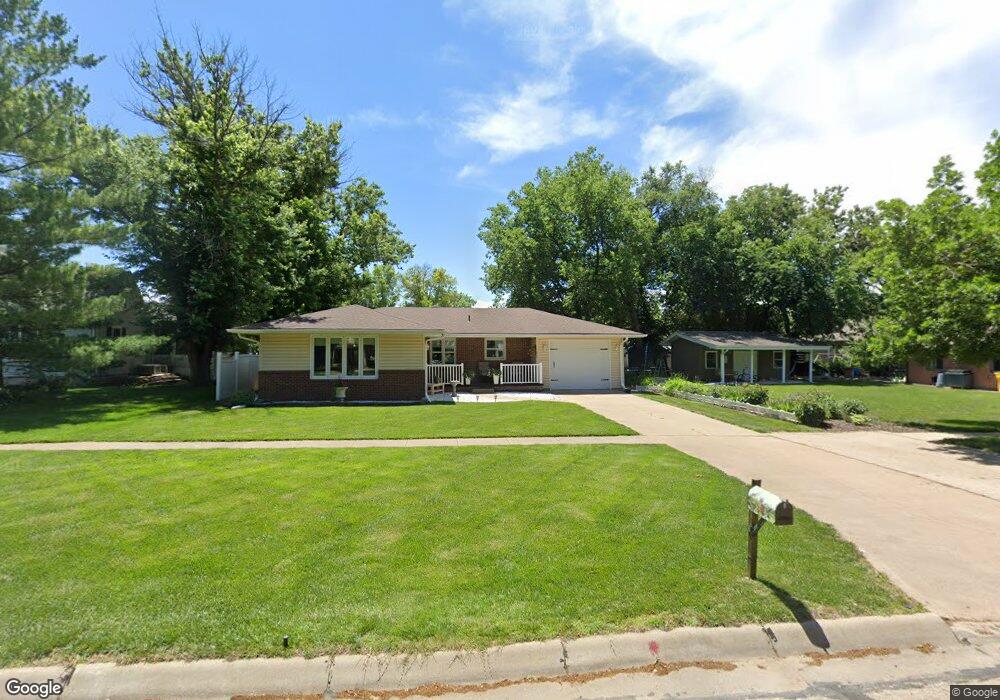
435 Eads Ave Hebron, NE 68370
Estimated Value: $194,293 - $205,000
2
Beds
2
Baths
1,156
Sq Ft
$173/Sq Ft
Est. Value
About This Home
This home is located at 435 Eads Ave, Hebron, NE 68370 and is currently estimated at $199,573, approximately $172 per square foot. 435 Eads Ave is a home located in Thayer County with nearby schools including Thayer Central Intermediate School and Thayer Central High School.
Create a Home Valuation Report for This Property
The Home Valuation Report is an in-depth analysis detailing your home's value as well as a comparison with similar homes in the area
Tax History
| Year | Tax Paid | Tax Assessment Tax Assessment Total Assessment is a certain percentage of the fair market value that is determined by local assessors to be the total taxable value of land and additions on the property. | Land | Improvement |
|---|---|---|---|---|
| 2025 | $274 | $178,480 | $11,575 | $166,905 |
| 2024 | $567 | $166,146 | $9,059 | $157,087 |
| 2023 | $567 | $143,893 | $7,549 | $136,344 |
| 2022 | $663 | $143,893 | $7,549 | $136,344 |
| 2021 | $553 | $129,335 | $6,039 | $123,296 |
| 2020 | $1,433 | $120,398 | $6,039 | $114,359 |
| 2019 | $1,739 | $114,378 | $6,039 | $108,339 |
| 2018 | $1,681 | $113,372 | $5,033 | $108,339 |
| 2017 | $1,251 | $113,372 | $5,033 | $108,339 |
| 2016 | $814 | $107,354 | $5,033 | $102,321 |
| 2015 | $937 | $107,678 | $5,033 | $102,645 |
| 2014 | $2,027 | $107,678 | $5,033 | $102,645 |
| 2013 | $2,027 | $106,951 | $5,033 | $101,918 |
Source: Public Records
Map
Nearby Homes
- 424 Union Ave
- 720 Eads Ave
- 527 N 3rd St
- 729 Olive Ave
- 532 Charles Rd
- 829 Eads Ave
- 133 S 7th St
- 1027 Lincoln Ave
- 409 Alice St
- 621 Road 5600
- 916 Thompson St
- 0 6300 Rd Unit 20240059
- 340 S Jefferson St
- 233 S Fillmore St
- 221 E Main St
- 133 N Fillmore St
- 340 N Jefferson St
- 801 E 6th St
- 202 E 12th St
- 204 N Poplar Ave
Your Personal Tour Guide
Ask me questions while you tour the home.