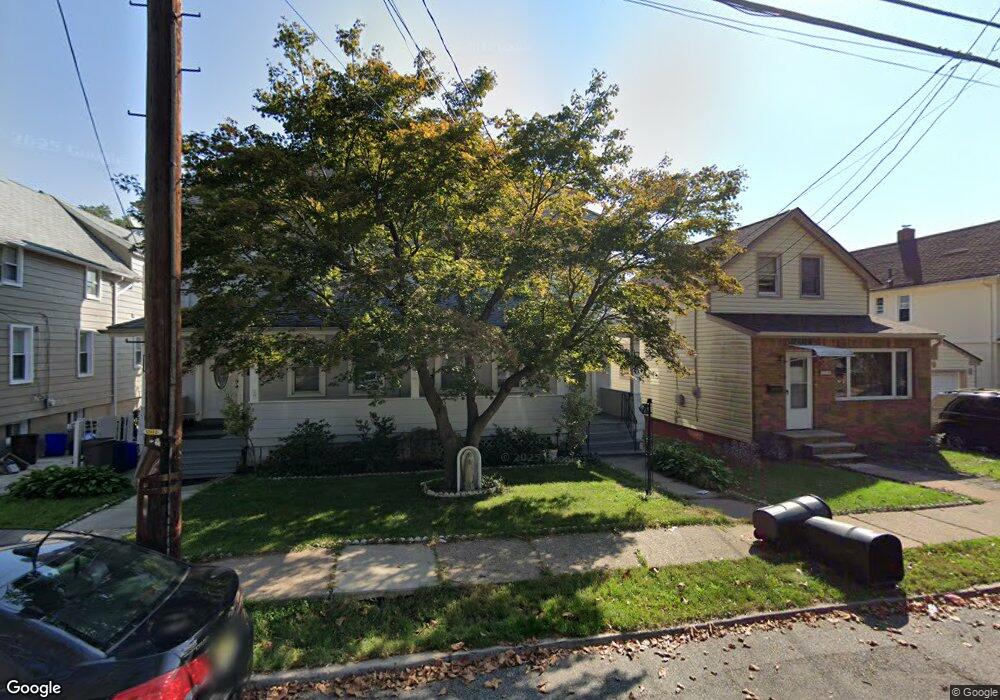
435 Elm Ave Bogota, NJ 07603
Estimated Value: $769,000 - $933,000
--
Bed
--
Bath
3,550
Sq Ft
$241/Sq Ft
Est. Value
About This Home
This home is located at 435 Elm Ave, Bogota, NJ 07603 and is currently estimated at $853,876, approximately $240 per square foot. 435 Elm Ave is a home located in Bergen County with nearby schools including Bogota Junior/Senior High School, Teaneck Community Charter School, and Bergen County Christian Academy.
Ownership History
Date
Name
Owned For
Owner Type
Purchase Details
Closed on
Jul 14, 2017
Sold by
Gutarra David and Gutarra Esperanza H
Bought by
Herrera Ariso and Luna Rocio
Current Estimated Value
Home Financials for this Owner
Home Financials are based on the most recent Mortgage that was taken out on this home.
Original Mortgage
$457,875
Outstanding Balance
$378,943
Interest Rate
3.75%
Mortgage Type
FHA
Estimated Equity
$474,933
Create a Home Valuation Report for This Property
The Home Valuation Report is an in-depth analysis detailing your home's value as well as a comparison with similar homes in the area
Home Values in the Area
Average Home Value in this Area
Purchase History
| Date | Buyer | Sale Price | Title Company |
|---|---|---|---|
| Herrera Ariso | $500,000 | First American Title |
Source: Public Records
Mortgage History
| Date | Status | Borrower | Loan Amount |
|---|---|---|---|
| Open | Herrera Ariso | $457,875 |
Source: Public Records
Tax History Compared to Growth
Tax History
| Year | Tax Paid | Tax Assessment Tax Assessment Total Assessment is a certain percentage of the fair market value that is determined by local assessors to be the total taxable value of land and additions on the property. | Land | Improvement |
|---|---|---|---|---|
| 2025 | $16,087 | $692,200 | $242,700 | $449,500 |
| 2024 | $16,781 | $692,200 | $242,700 | $449,500 |
| 2023 | $16,511 | $390,800 | $139,300 | $251,500 |
| 2022 | $16,511 | $390,800 | $139,300 | $251,500 |
| 2021 | $16,171 | $390,800 | $139,300 | $251,500 |
| 2020 | $15,917 | $390,800 | $139,300 | $251,500 |
| 2019 | $15,702 | $390,800 | $139,300 | $251,500 |
| 2018 | $15,319 | $390,800 | $139,300 | $251,500 |
| 2017 | $14,850 | $390,800 | $139,300 | $251,500 |
| 2016 | $14,745 | $390,800 | $139,300 | $251,500 |
| 2015 | $14,573 | $390,800 | $139,300 | $251,500 |
| 2014 | $14,186 | $390,800 | $139,300 | $251,500 |
Source: Public Records
Map
Nearby Homes