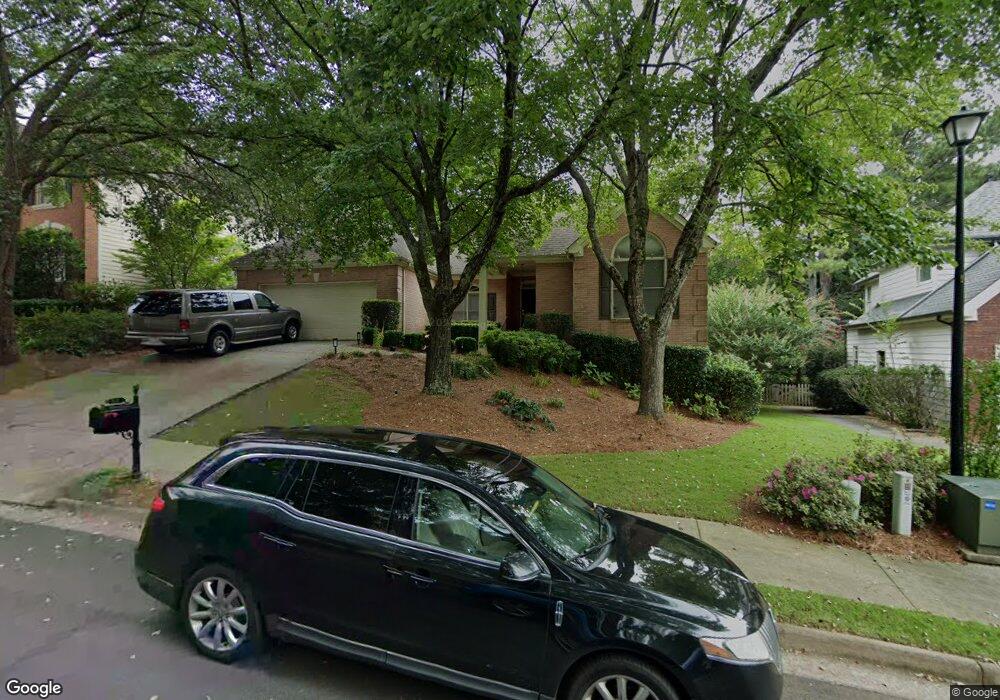
435 Fieldstone Landing Alpharetta, GA 30005
Windward NeighborhoodEstimated Value: $641,000 - $738,000
4
Beds
3
Baths
2,322
Sq Ft
$298/Sq Ft
Est. Value
About This Home
This home is located at 435 Fieldstone Landing, Alpharetta, GA 30005 and is currently estimated at $692,448, approximately $298 per square foot. 435 Fieldstone Landing is a home located in Fulton County with nearby schools including Creek View Elementary School, Webb Bridge Middle School, and Alpharetta High School.
Ownership History
Date
Name
Owned For
Owner Type
Purchase Details
Closed on
Feb 18, 2003
Sold by
Lucas Tamara J and Lucas Howard C
Bought by
Lucas Tamara J and Lucas Howard C
Current Estimated Value
Home Financials for this Owner
Home Financials are based on the most recent Mortgage that was taken out on this home.
Original Mortgage
$27,800
Outstanding Balance
$4,627
Interest Rate
5.89%
Mortgage Type
Unknown
Estimated Equity
$687,821
Purchase Details
Closed on
Apr 8, 1993
Sold by
Highland Homes Inc
Bought by
Lucas Howard C Tamara
Home Financials for this Owner
Home Financials are based on the most recent Mortgage that was taken out on this home.
Original Mortgage
$147,500
Interest Rate
7.53%
Create a Home Valuation Report for This Property
The Home Valuation Report is an in-depth analysis detailing your home's value as well as a comparison with similar homes in the area
Home Values in the Area
Average Home Value in this Area
Purchase History
| Date | Buyer | Sale Price | Title Company |
|---|---|---|---|
| Lucas Tamara J | -- | -- | |
| Lucas Howard C Tamara | $188,300 | -- |
Source: Public Records
Mortgage History
| Date | Status | Borrower | Loan Amount |
|---|---|---|---|
| Open | Lucas Tamara J | $27,800 | |
| Closed | Lucas Tamara J | $217,000 | |
| Previous Owner | Lucas Howard C Tamara | $147,500 |
Source: Public Records
Tax History Compared to Growth
Tax History
| Year | Tax Paid | Tax Assessment Tax Assessment Total Assessment is a certain percentage of the fair market value that is determined by local assessors to be the total taxable value of land and additions on the property. | Land | Improvement |
|---|---|---|---|---|
| 2025 | $653 | $278,280 | $60,600 | $217,680 |
| 2023 | $6,040 | $214,000 | $36,760 | $177,240 |
| 2022 | $3,253 | $214,000 | $36,760 | $177,240 |
| 2021 | $3,785 | $166,040 | $35,720 | $130,320 |
| 2020 | $3,812 | $169,160 | $31,720 | $137,440 |
| 2019 | $563 | $162,440 | $27,480 | $134,960 |
| 2018 | $3,806 | $158,640 | $26,840 | $131,800 |
| 2017 | $3,161 | $120,280 | $27,920 | $92,360 |
| 2016 | $3,160 | $120,280 | $27,920 | $92,360 |
| 2015 | $3,664 | $120,280 | $27,920 | $92,360 |
| 2014 | $3,294 | $120,280 | $27,920 | $92,360 |
Source: Public Records
Map
Nearby Homes
- 425 Fieldstone Landing
- 1230 Greatwood Manor
- 2485 Hamptons Passage
- 2120 Blackheath Trace
- 13042 Dartmore Ave
- 12981 Dartmore Cir
- 5370 McGinnis Ferry Rd
- 12595 Huntington Trace
- 1065 Beacon Hill Crossing
- 2250 Blackheath Trace
- 5510 Vicarage Walk
- 12470 Concord Hall Dr
- 5635 Ashewoode Downs Dr
- 1250 Rosewood Dr
- 10 Club Ct
- 140 Ashewoode Downs Ln
- 1385 Woodvine Way
- 1075 Carnoustie Ln
- 680 Evening Pine Ln
- 2255 Rose Walk Dr
- 445 Fieldstone Landing
- 1215 Greatwood Manor
- 1215 Greatwood Manor Unit 1215
- 415 Fieldstone Landing
- 410 Fieldstone Landing
- 1205 Greatwood Manor
- 1225 Greatwood Manor
- 1235 Greatwood Manor
- 420 Fieldstone Landing
- 1195 Greatwood Manor
- 455 Fieldstone Landing
- 3555 Fieldstone Crossing
- 1185 Greatwood Manor
- 430 Fieldstone Landing
- 3515 Fieldstone Crossing
- 3565 Fieldstone Crossing
- 465 Fieldstone Landing
- 3751 Fieldstone Crossing
- 475 Fieldstone Landing
- 3505 Fieldstone Crossing