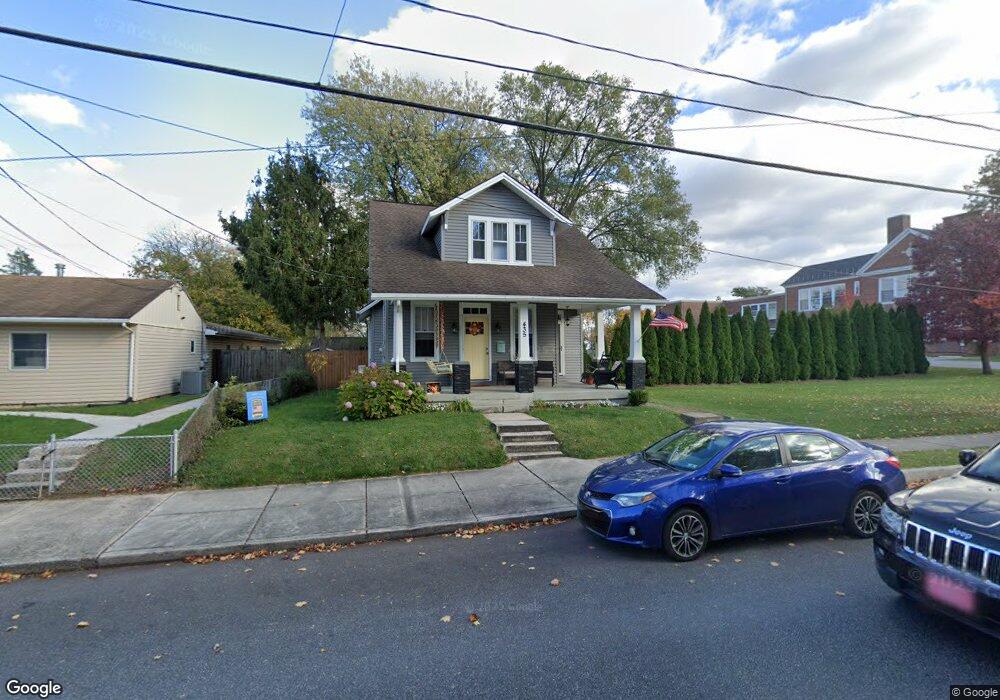
435 Franklin St Carlisle, PA 17013
Estimated Value: $216,497 - $241,000
3
Beds
2
Baths
1,187
Sq Ft
$194/Sq Ft
Est. Value
About This Home
This home is located at 435 Franklin St, Carlisle, PA 17013 and is currently estimated at $230,374, approximately $194 per square foot. 435 Franklin St is a home located in Cumberland County with nearby schools including Bellaire Elementary School, Wilson Middle School, and Carlisle Area High School.
Ownership History
Date
Name
Owned For
Owner Type
Purchase Details
Closed on
May 25, 2007
Sold by
Ayers Edward C
Bought by
Jones David R
Current Estimated Value
Home Financials for this Owner
Home Financials are based on the most recent Mortgage that was taken out on this home.
Original Mortgage
$106,067
Outstanding Balance
$64,763
Interest Rate
6.24%
Mortgage Type
FHA
Estimated Equity
$165,611
Purchase Details
Closed on
Apr 29, 2004
Sold by
Nygaard Jeffrey G
Bought by
Ayers Edward C
Home Financials for this Owner
Home Financials are based on the most recent Mortgage that was taken out on this home.
Original Mortgage
$110,000
Interest Rate
5.36%
Mortgage Type
New Conventional
Purchase Details
Closed on
Sep 13, 2003
Sold by
Oppenheim David
Bought by
Nygaard Jeffrey G
Home Financials for this Owner
Home Financials are based on the most recent Mortgage that was taken out on this home.
Original Mortgage
$82,000
Interest Rate
5.82%
Mortgage Type
New Conventional
Create a Home Valuation Report for This Property
The Home Valuation Report is an in-depth analysis detailing your home's value as well as a comparison with similar homes in the area
Home Values in the Area
Average Home Value in this Area
Purchase History
| Date | Buyer | Sale Price | Title Company |
|---|---|---|---|
| Jones David R | $133,000 | -- | |
| Ayers Edward C | $107,000 | -- | |
| Nygaard Jeffrey G | $82,000 | -- |
Source: Public Records
Mortgage History
| Date | Status | Borrower | Loan Amount |
|---|---|---|---|
| Open | Jones David R | $106,067 | |
| Previous Owner | Ayers Edward C | $110,000 | |
| Previous Owner | Nygaard Jeffrey G | $82,000 |
Source: Public Records
Tax History Compared to Growth
Tax History
| Year | Tax Paid | Tax Assessment Tax Assessment Total Assessment is a certain percentage of the fair market value that is determined by local assessors to be the total taxable value of land and additions on the property. | Land | Improvement |
|---|---|---|---|---|
| 2025 | $3,214 | $136,500 | $19,000 | $117,500 |
| 2024 | $3,122 | $136,500 | $19,000 | $117,500 |
| 2023 | $2,980 | $136,500 | $19,000 | $117,500 |
| 2022 | $2,937 | $136,500 | $19,000 | $117,500 |
| 2021 | $2,895 | $136,500 | $19,000 | $117,500 |
| 2020 | $2,834 | $136,500 | $19,000 | $117,500 |
| 2019 | $2,775 | $136,500 | $19,000 | $117,500 |
| 2018 | $2,715 | $136,500 | $19,000 | $117,500 |
| 2017 | $2,661 | $136,500 | $19,000 | $117,500 |
| 2016 | -- | $136,500 | $19,000 | $117,500 |
| 2015 | -- | $136,500 | $19,000 | $117,500 |
| 2014 | -- | $136,500 | $19,000 | $117,500 |
Source: Public Records
Map
Nearby Homes
- 329 Franklin St
- 0 Cherry St
- 404 W Penn St
- 232 Cherry St
- 208 N West St
- 410 N Pitt St
- 817 N West St
- 220 N Pitt St
- 906 N West St
- 920 N West St
- 10 Skip Ln
- 670 W Louther St
- 1138 Franklin St
- Carter Plan at Grange - Single Family
- Corby Plan at Grange - Single Family
- Arundel Plan at Grange - Single Family
- Royston Plan at Grange - Single Family
- Elgin Plan at Grange - Single Family
- Anders Plan at Grange - Single Family
- Darby Plan at Grange - Single Family