435 Hammond Ave Mansfield, OH 44902
Estimated Value: $80,000 - $131,000
3
Beds
1
Bath
1,194
Sq Ft
$80/Sq Ft
Est. Value
About This Home
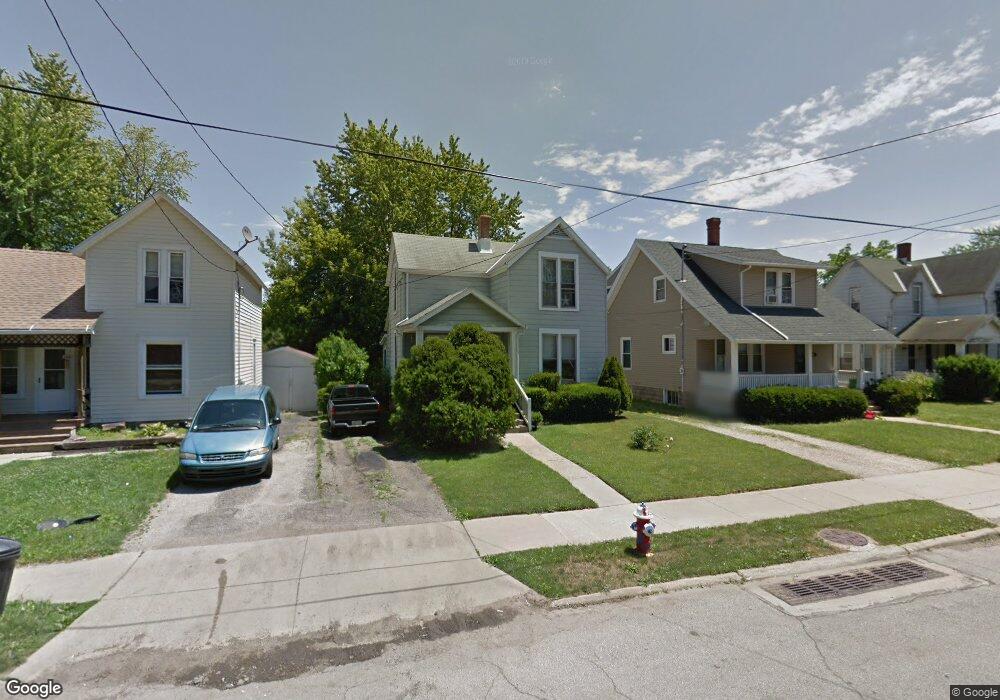
This home is located at 435 Hammond Ave, Mansfield, OH 44902 and is currently estimated at $95,115, approximately $79 per square foot. 435 Hammond Ave is a home located in Richland County with nearby schools including St. Peter's Elementary/Montessori School, St. Peter's High School/Junior High, and Discovery School.
Ownership History
Date
Name
Owned For
Owner Type
Purchase Details
Closed on
Feb 3, 2015
Sold by
Boyer Timothy and Boyer Patrick
Bought by
Boyer Michael
Current Estimated Value
Purchase Details
Closed on
Aug 29, 2014
Sold by
Estate Of Lyda Mae Boyer
Bought by
Boyer Patrick and Boyer Timothy
Create a Home Valuation Report for This Property
The Home Valuation Report is an in-depth analysis detailing your home's value as well as a comparison with similar homes in the area
Home Values in the Area
Average Home Value in this Area
Purchase History
| Date | Buyer | Sale Price | Title Company |
|---|---|---|---|
| Boyer Michael | -- | Attorney | |
| Boyer Patrick | -- | None Available |
Source: Public Records
Tax History Compared to Growth
Tax History
| Year | Tax Paid | Tax Assessment Tax Assessment Total Assessment is a certain percentage of the fair market value that is determined by local assessors to be the total taxable value of land and additions on the property. | Land | Improvement |
|---|---|---|---|---|
| 2024 | $344 | $17,150 | $2,390 | $14,760 |
| 2023 | $344 | $17,150 | $2,390 | $14,760 |
| 2022 | $289 | $13,930 | $2,310 | $11,620 |
| 2021 | $291 | $13,930 | $2,310 | $11,620 |
| 2020 | $298 | $13,930 | $2,310 | $11,620 |
| 2019 | $195 | $11,810 | $1,960 | $9,850 |
| 2018 | $743 | $11,810 | $1,960 | $9,850 |
| 2017 | $642 | $11,810 | $1,960 | $9,850 |
| 2016 | $561 | $8,890 | $2,270 | $6,620 |
| 2015 | $561 | $8,890 | $2,270 | $6,620 |
| 2014 | $529 | $8,890 | $2,270 | $6,620 |
| 2012 | $202 | $8,890 | $2,390 | $6,500 |
Source: Public Records
Map
Nearby Homes
- 394 S Main St
- 327 Hammond Ave
- 319 Altamont Ave
- 69 Reba Ave
- 286 S Main St
- 137 Lexington Ave
- 172 -172 1 2 Lexington Ave
- 259 S Main St
- 120 Grover St
- 223 Reform St
- 430 Beethoven St
- 519 S Diamond St
- 674 Hillgrove Ave
- 681 Hillgrove Ave
- 0 Cline Ave Hedeen Abbeyfeale Unit 9066362
- 212 S Main St
- 353 Sturges Ave
- 490 Rembrandt St
- 96 Glenwood Heights
- 181 Chilton Ave
- 431 Hammond Ave
- 439 Hammond Ave
- 443 Hammond Ave
- 427 Hammond Ave
- 445 Hammond Ave
- 423 Hammond Ave
- 451 Hammond Ave
- 440 Hammond Ave
- 436 Hammond Ave
- 428 Hammond Ave
- 417 Hammond Ave
- 455 Hammond Ave
- 446 Hammond Ave
- 426 Hammond Ave
- 413 Hammond Ave
- 27 Prospect St E
- 452 Hammond Ave
- 422 Hammond Ave
- 418 Hammond Ave
- 461 Hammond Ave