Estimated Value: $187,744 - $219,000
3
Beds
1
Bath
927
Sq Ft
$222/Sq Ft
Est. Value
About This Home
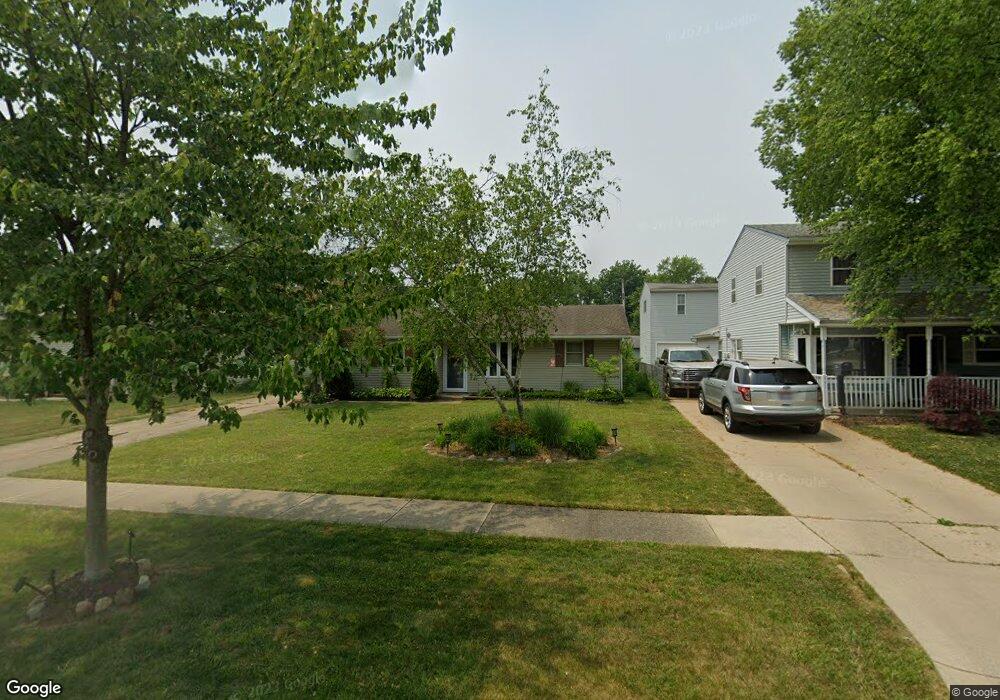
This home is located at 435 Hazel Dr, Berea, OH 44017 and is currently estimated at $206,186, approximately $222 per square foot. 435 Hazel Dr is a home located in Cuyahoga County with nearby schools including Grindstone Elementary School, Berea-Midpark Middle School, and Berea-Midpark High School.
Ownership History
Date
Name
Owned For
Owner Type
Purchase Details
Closed on
Sep 18, 1997
Sold by
Landon Bryan C
Bought by
Corrigan Daniel J and Corrigan Tammy M
Current Estimated Value
Home Financials for this Owner
Home Financials are based on the most recent Mortgage that was taken out on this home.
Original Mortgage
$92,894
Outstanding Balance
$14,498
Interest Rate
7.55%
Mortgage Type
FHA
Estimated Equity
$191,688
Purchase Details
Closed on
Jun 30, 1993
Sold by
Ryan Kenneth J
Bought by
Landon Bryan C
Purchase Details
Closed on
Dec 29, 1986
Sold by
Yoshizawa Sandra J
Bought by
Ryan Kenneth J
Purchase Details
Closed on
Apr 18, 1984
Sold by
Yoshizawa James B
Bought by
Yoshizawa Sandra J
Purchase Details
Closed on
Aug 26, 1976
Sold by
Golya Edward M and C A
Bought by
Yoshizawa James B
Purchase Details
Closed on
Jan 1, 1975
Bought by
Golya Edward M and C A
Create a Home Valuation Report for This Property
The Home Valuation Report is an in-depth analysis detailing your home's value as well as a comparison with similar homes in the area
Home Values in the Area
Average Home Value in this Area
Purchase History
| Date | Buyer | Sale Price | Title Company |
|---|---|---|---|
| Corrigan Daniel J | $93,000 | -- | |
| Landon Bryan C | $67,400 | -- | |
| Ryan Kenneth J | $53,000 | -- | |
| Yoshizawa Sandra J | -- | -- | |
| Yoshizawa James B | $33,600 | -- | |
| Golya Edward M | -- | -- |
Source: Public Records
Mortgage History
| Date | Status | Borrower | Loan Amount |
|---|---|---|---|
| Open | Corrigan Daniel J | $92,894 |
Source: Public Records
Tax History
| Year | Tax Paid | Tax Assessment Tax Assessment Total Assessment is a certain percentage of the fair market value that is determined by local assessors to be the total taxable value of land and additions on the property. | Land | Improvement |
|---|---|---|---|---|
| 2024 | $4,902 | $55,265 | $11,690 | $43,575 |
| 2023 | $4,547 | $41,160 | $9,450 | $31,710 |
| 2022 | $2,888 | $41,160 | $9,450 | $31,710 |
| 2021 | $4,990 | $41,160 | $9,450 | $31,710 |
| 2020 | $4,857 | $34,900 | $8,020 | $26,880 |
| 2019 | $4,307 | $99,700 | $22,900 | $76,800 |
| 2018 | $4,964 | $34,900 | $8,020 | $26,880 |
| 2017 | $4,562 | $33,220 | $6,830 | $26,390 |
| 2016 | $4,997 | $33,220 | $6,830 | $26,390 |
| 2015 | $4,384 | $33,220 | $6,830 | $26,390 |
| 2014 | $4,384 | $34,970 | $7,180 | $27,790 |
Source: Public Records
Map
Nearby Homes
- 428 Park Place
- 379 Laurel Dr
- 487 Karen Dr
- 446 Redwood Dr
- 445 Berea St
- 146 Marian Ln
- 628 Lindbergh Blvd
- 404 Crescent Dr
- 160 Marian Ln Unit 6A
- 160 Stonepointe Dr
- 93 W 5th Ave
- 725 Shakespeare Dr
- 211 W Bridge St
- 216 Kraft St
- 287 Edgewood Dr
- 300 West St
- 209 Gibson St
- 41 W 5th Ave
- 388 Fairwood Cir
- 56 3rd Ave
Your Personal Tour Guide
Ask me questions while you tour the home.