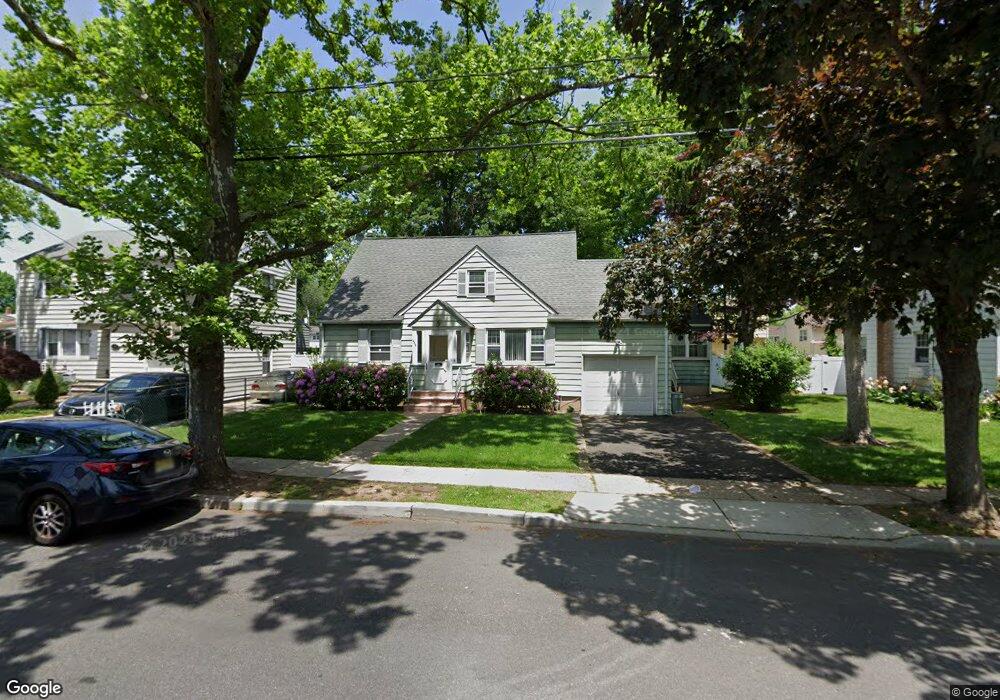
435 Hory St Roselle, NJ 07203
Estimated Value: $447,000 - $542,000
Studio
--
Bath
944
Sq Ft
$505/Sq Ft
Est. Value
About This Home
This home is located at 435 Hory St, Roselle, NJ 07203 and is currently estimated at $476,457, approximately $504 per square foot. 435 Hory St is a home located in Union County with nearby schools including Washington Elementary School, Leonard V. Moore Middle School, and Grace Wilday Junior High School.
Ownership History
Date
Name
Owned For
Owner Type
Purchase Details
Closed on
Apr 27, 2007
Sold by
Etienne Luckson
Bought by
Berfet Cheryl
Current Estimated Value
Home Financials for this Owner
Home Financials are based on the most recent Mortgage that was taken out on this home.
Original Mortgage
$256,500
Outstanding Balance
$156,531
Interest Rate
6.23%
Mortgage Type
Purchase Money Mortgage
Estimated Equity
$319,926
Purchase Details
Closed on
Mar 31, 2006
Sold by
Bullock Mary
Bought by
Luckson Etienne
Create a Home Valuation Report for This Property
The Home Valuation Report is an in-depth analysis detailing your home's value as well as a comparison with similar homes in the area
Home Values in the Area
Average Home Value in this Area
Purchase History
| Date | Buyer | Sale Price | Title Company |
|---|---|---|---|
| Berfet Cheryl | $270,000 | Surety Title Corporation | |
| Luckson Etienne | $240,000 | -- |
Source: Public Records
Mortgage History
| Date | Status | Borrower | Loan Amount |
|---|---|---|---|
| Open | Berfet Cheryl | $256,500 |
Source: Public Records
Tax History
| Year | Tax Paid | Tax Assessment Tax Assessment Total Assessment is a certain percentage of the fair market value that is determined by local assessors to be the total taxable value of land and additions on the property. | Land | Improvement |
|---|---|---|---|---|
| 2025 | $11,356 | $130,600 | $65,000 | $65,600 |
| 2024 | $11,071 | $130,600 | $65,000 | $65,600 |
| 2023 | $11,071 | $130,600 | $65,000 | $65,600 |
| 2022 | $11,148 | $130,600 | $65,000 | $65,600 |
| 2021 | $11,081 | $130,600 | $65,000 | $65,600 |
| 2020 | $11,046 | $130,600 | $65,000 | $65,600 |
| 2019 | $10,905 | $130,600 | $65,000 | $65,600 |
| 2018 | $10,845 | $130,600 | $65,000 | $65,600 |
| 2017 | $10,788 | $130,600 | $65,000 | $65,600 |
| 2016 | $10,550 | $130,600 | $65,000 | $65,600 |
| 2015 | $10,549 | $130,600 | $65,000 | $65,600 |
| 2014 | $10,255 | $130,600 | $65,000 | $65,600 |
Source: Public Records
Map
Nearby Homes
Your Personal Tour Guide
Ask me questions while you tour the home.