Estimated Value: $296,000 - $925,000
5
Beds
4
Baths
2,072
Sq Ft
$295/Sq Ft
Est. Value
About This Home
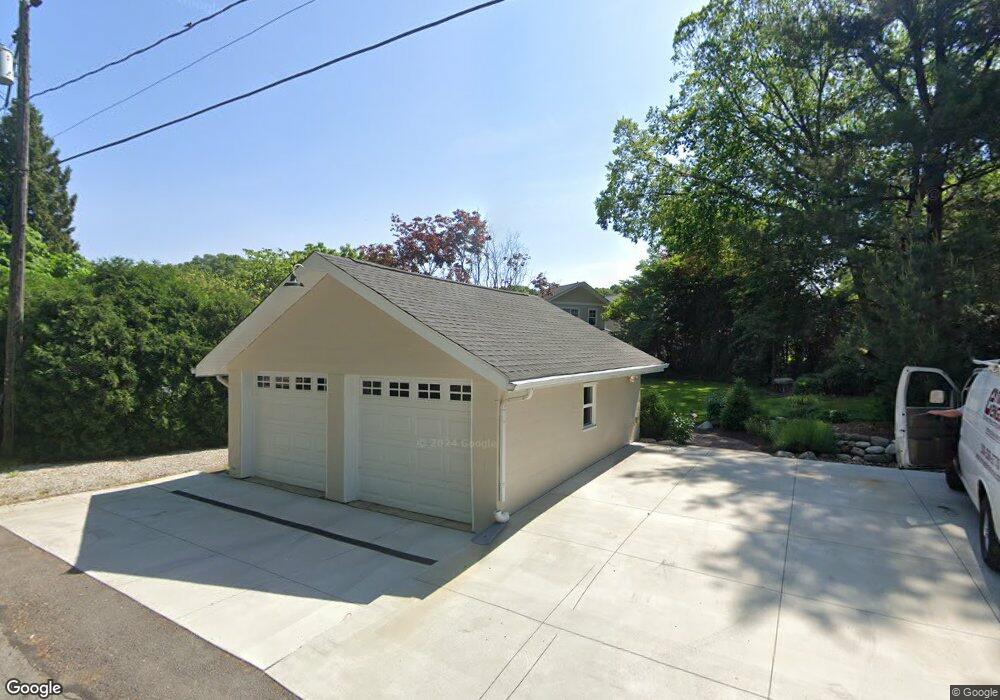
This home is located at 435 Hunsicker Dr, Akron, OH 44319 and is currently estimated at $610,760, approximately $294 per square foot. 435 Hunsicker Dr is a home located in Summit County with nearby schools including Coventry Middle School, Coventry High School, and St. Francis de Sales School.
Ownership History
Date
Name
Owned For
Owner Type
Purchase Details
Closed on
May 25, 2017
Sold by
Mccombs Thomas L and Mccombs Mary L
Bought by
Let It Run Llc
Current Estimated Value
Purchase Details
Closed on
Dec 15, 2016
Sold by
Baker Carol S
Bought by
Mccombs Thomas L and Mccombs Mary L
Purchase Details
Closed on
Sep 21, 2001
Sold by
Mccombs Thomas L
Bought by
Holshue Elinor E and The 4156 Hunsicker Dr Land Trust
Purchase Details
Closed on
Jan 12, 2001
Sold by
Wmc Mtg Corp
Bought by
Mccombs Thomas L
Home Financials for this Owner
Home Financials are based on the most recent Mortgage that was taken out on this home.
Original Mortgage
$204,000
Interest Rate
7.58%
Mortgage Type
Purchase Money Mortgage
Purchase Details
Closed on
Oct 5, 2000
Sold by
Bodis John
Bought by
Wmc Mtg Corp
Purchase Details
Closed on
Jun 16, 1998
Sold by
Bodis John
Bought by
Williams Walter A
Create a Home Valuation Report for This Property
The Home Valuation Report is an in-depth analysis detailing your home's value as well as a comparison with similar homes in the area
Home Values in the Area
Average Home Value in this Area
Purchase History
| Date | Buyer | Sale Price | Title Company |
|---|---|---|---|
| Let It Run Llc | $447,500 | Kingdom Title | |
| Mccombs Thomas L | -- | Kingdom Title | |
| Holshue Elinor E | -- | -- | |
| Mccombs Thomas L | $255,000 | -- | |
| Wmc Mtg Corp | $200,000 | -- | |
| Williams Walter A | $5,000 | -- |
Source: Public Records
Mortgage History
| Date | Status | Borrower | Loan Amount |
|---|---|---|---|
| Previous Owner | Mccombs Thomas L | $204,000 | |
| Closed | Mccombs Thomas L | $51,000 |
Source: Public Records
Tax History
| Year | Tax Paid | Tax Assessment Tax Assessment Total Assessment is a certain percentage of the fair market value that is determined by local assessors to be the total taxable value of land and additions on the property. | Land | Improvement |
|---|---|---|---|---|
| 2025 | $11,089 | $217,662 | $53,837 | $163,825 |
| 2024 | $11,089 | $217,662 | $53,837 | $163,825 |
| 2023 | $11,089 | $217,662 | $53,837 | $163,825 |
| 2022 | $8,758 | $147,021 | $36,134 | $110,887 |
| 2021 | $8,768 | $147,021 | $36,134 | $110,887 |
| 2020 | $8,531 | $147,020 | $36,130 | $110,890 |
| 2019 | $7,457 | $118,070 | $41,150 | $76,920 |
| 2018 | $7,120 | $113,950 | $41,150 | $72,800 |
| 2017 | $5,832 | $113,950 | $41,150 | $72,800 |
| 2016 | $5,748 | $95,980 | $21,570 | $74,410 |
| 2015 | $5,832 | $95,980 | $21,570 | $74,410 |
| 2014 | $5,845 | $95,980 | $21,570 | $74,410 |
| 2013 | $5,676 | $86,250 | $21,570 | $64,680 |
Source: Public Records
Map
Nearby Homes
- 277 Lake Front Dr
- 4135 State Park Dr
- 556 Kruger Ave
- 3812 N Glenridge Rd
- 3809 N Glenridge Rd
- 221 Lake Front Dr
- 265 E Pace Ave
- 68 Starboard Cir
- 4216 State Rd
- 3785 S Main St
- 4387 Point Comfort Dr
- 4567 Rex Lake Dr
- 3917 Cayugas Dr
- 4298 S Main St Unit 4302
- 855 Fowler Ave
- 428 Canova Dr
- 3809 Powell Ave
- 3826 Powell Ave
- 231 Portage Lakes Dr
- 72 Weil Ave
- 4156 Hunsicker Dr
- 4170 Hunsicker Dr
- 4138 Hunsicker Dr
- 4141 Hunsicker Dr
- 417 Hunsicker Dr
- 416 Hunsicker Dr
- 4124 Hunsicker Dr
- 409 Hunsicker Dr
- 4137 Hunsicker Dr
- 410 Hunsicker Dr
- 4014 Tarlton Ave
- 4184 Hunsicker Dr
- 4116 Hunsicker Dr
- 425 Kirk Ave
- 400 Hunsicker Dr
- 417 Kirk Ave
- 4200 Hunsicker Dr
- 4159 Melcher Ave
- 4153 Melcher Ave
- 4147 Melcher Ave
Your Personal Tour Guide
Ask me questions while you tour the home.