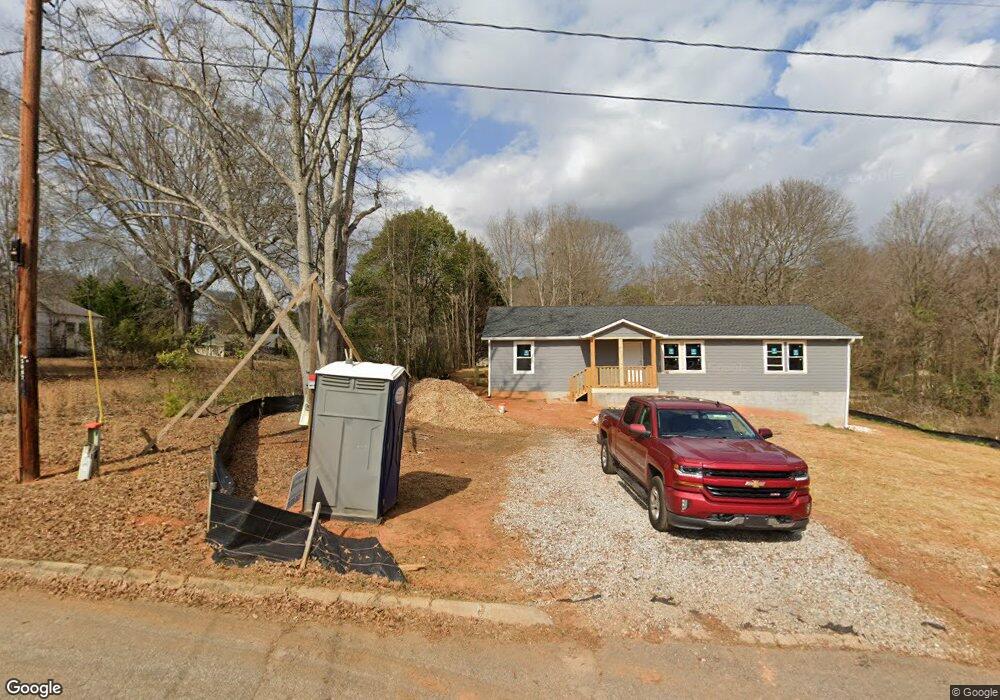
435 Lang St Griffin, GA 30223
Spalding County NeighborhoodEstimated Value: $148,000
--
Bed
--
Bath
--
Sq Ft
7,405
Sq Ft Lot
About This Home
This home is located at 435 Lang St, Griffin, GA 30223 and is currently priced at $148,000. 435 Lang St is a home located in Spalding County with nearby schools including Jackson Road Elementary School, Kennedy Road Middle School, and Spalding High School.
Ownership History
Date
Name
Owned For
Owner Type
Purchase Details
Closed on
May 2, 2019
Sold by
Community Bank Of Pickens County
Bought by
Ijm Hiram Llc
Current Estimated Value
Purchase Details
Closed on
Apr 12, 2019
Sold by
Ijm Hiram Llc
Bought by
Griffin Area Habitat For Humanity Inc
Purchase Details
Closed on
Mar 3, 2016
Sold by
Hollberg Douglas S
Bought by
Ijm Hiram Llc
Home Financials for this Owner
Home Financials are based on the most recent Mortgage that was taken out on this home.
Original Mortgage
$1,598,497
Interest Rate
2.94%
Purchase Details
Closed on
May 1, 1991
Sold by
Hollberg M Douglas
Bought by
Hollberg Douglas S
Purchase Details
Closed on
Jul 1, 1976
Sold by
Hollberg M Douglas
Bought by
Hollberg M Douglas
Purchase Details
Closed on
Sep 18, 1964
Sold by
Golden Chester S
Bought by
Hollberg M Douglas
Purchase Details
Closed on
Aug 28, 1956
Bought by
Golden Chester C
Create a Home Valuation Report for This Property
The Home Valuation Report is an in-depth analysis detailing your home's value as well as a comparison with similar homes in the area
Home Values in the Area
Average Home Value in this Area
Purchase History
| Date | Buyer | Sale Price | Title Company |
|---|---|---|---|
| Ijm Hiram Llc | -- | -- | |
| Griffin Area Habitat For Humanity Inc | -- | -- | |
| Ijm Hiram Llc | $1,100,000 | -- | |
| Hollberg Douglas S | $78,000 | -- | |
| Hollberg M Douglas | $562,500 | -- | |
| Hollberg M Douglas | $2,800 | -- | |
| Golden Chester C | -- | -- |
Source: Public Records
Mortgage History
| Date | Status | Borrower | Loan Amount |
|---|---|---|---|
| Previous Owner | Ijm Hiram Llc | $1,598,497 |
Source: Public Records
Tax History Compared to Growth
Tax History
| Year | Tax Paid | Tax Assessment Tax Assessment Total Assessment is a certain percentage of the fair market value that is determined by local assessors to be the total taxable value of land and additions on the property. | Land | Improvement |
|---|---|---|---|---|
| 2023 | $69 | $1,920 | $1,920 | $0 |
| 2022 | $44 | $1,200 | $1,200 | $0 |
| 2021 | $44 | $1,200 | $1,200 | $0 |
| 2020 | $44 | $1,200 | $1,200 | $0 |
| 2019 | $45 | $1,200 | $1,200 | $0 |
| 2018 | $46 | $1,200 | $1,200 | $0 |
| 2017 | $45 | $1,200 | $1,200 | $0 |
| 2016 | $45 | $1,200 | $1,200 | $0 |
| 2015 | $47 | $1,200 | $1,200 | $0 |
| 2014 | $48 | $1,200 | $1,200 | $0 |
Source: Public Records
Map
Nearby Homes
- 251 Lang St
- 132 Lang St
- 1029 High Falls Rd
- 406 Pinelea Rd
- 911 Clayton St
- 917 E Broadway St
- 170 Jackson Ln
- 108 Jackson Ln
- 1765 High Falls Rd
- 512 Searcy Ave
- 320 Morris St
- 8 RENTALS HOUSE 712 Searcy Ave
- 127 Kennedy Rd
- 303 E Broadway St
- 715 E Chappell St
- 203 N 1st St
- 588 Elles Way
- 234 N 2nd St
- 523 E Chappell St
- 602 Circus St