Estimated Value: $213,000 - $256,000
3
Beds
2
Baths
1,840
Sq Ft
$131/Sq Ft
Est. Value
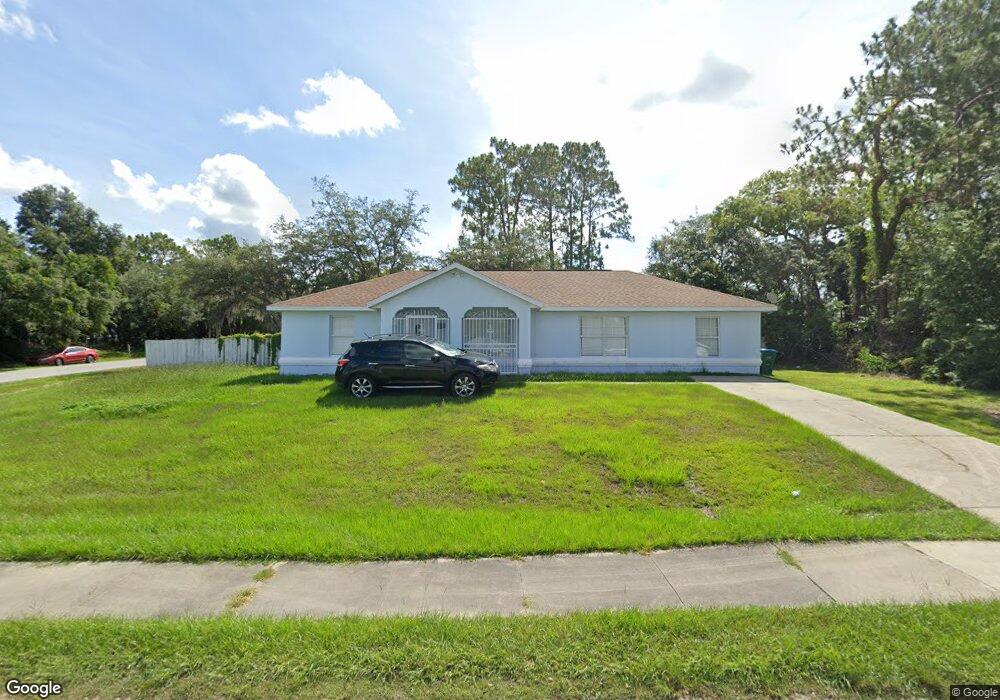
About This Home
This home is located at 435 Marion Oaks Course, Ocala, FL 34473 and is currently estimated at $241,335, approximately $131 per square foot. 435 Marion Oaks Course is a home located in Marion County with nearby schools including Sunrise Elementary School, Horizon Academy At Marion Oaks, and Dunnellon High School.
Ownership History
Date
Name
Owned For
Owner Type
Purchase Details
Closed on
Apr 19, 2019
Sold by
Lancret Lancret Ninette Ninette and Lancret Pratts Ninette
Bought by
Gonzalez Eimer Llera and Gonzalez Sheila
Current Estimated Value
Home Financials for this Owner
Home Financials are based on the most recent Mortgage that was taken out on this home.
Original Mortgage
$115,151
Outstanding Balance
$101,442
Interest Rate
4.4%
Mortgage Type
New Conventional
Estimated Equity
$139,893
Purchase Details
Closed on
Sep 2, 2011
Sold by
Prats Raymond Bravo and Prats Ninette Lancret
Bought by
Prats Ninette Lancret
Purchase Details
Closed on
Jun 29, 2001
Sold by
Metzger Robert D and Metzger Janet O
Bought by
Bravo Raymond and Bravo Ninette
Home Financials for this Owner
Home Financials are based on the most recent Mortgage that was taken out on this home.
Original Mortgage
$57,600
Interest Rate
7.17%
Create a Home Valuation Report for This Property
The Home Valuation Report is an in-depth analysis detailing your home's value as well as a comparison with similar homes in the area
Home Values in the Area
Average Home Value in this Area
Purchase History
| Date | Buyer | Sale Price | Title Company |
|---|---|---|---|
| Gonzalez Eimer Llera | $110,000 | Marion Lake Sumter Title Llc | |
| Prats Ninette Lancret | -- | Attorney | |
| Bravo Raymond | $72,000 | Security First Title Partner |
Source: Public Records
Mortgage History
| Date | Status | Borrower | Loan Amount |
|---|---|---|---|
| Open | Gonzalez Eimer Llera | $115,151 | |
| Previous Owner | Bravo Raymond | $57,600 |
Source: Public Records
Tax History Compared to Growth
Tax History
| Year | Tax Paid | Tax Assessment Tax Assessment Total Assessment is a certain percentage of the fair market value that is determined by local assessors to be the total taxable value of land and additions on the property. | Land | Improvement |
|---|---|---|---|---|
| 2024 | $2,141 | $144,646 | -- | -- |
| 2023 | $2,086 | $140,433 | $0 | $0 |
| 2022 | $2,001 | $136,343 | $0 | $0 |
| 2021 | $1,990 | $132,372 | $7,950 | $124,422 |
| 2020 | $2,439 | $117,180 | $5,900 | $111,280 |
| 2019 | $2,300 | $113,165 | $4,950 | $108,215 |
| 2018 | $2,089 | $106,790 | $4,250 | $102,540 |
| 2017 | $1,910 | $92,995 | $3,400 | $89,595 |
| 2016 | $1,802 | $78,676 | $0 | $0 |
| 2015 | $1,632 | $71,524 | $0 | $0 |
| 2014 | $1,491 | $65,022 | $0 | $0 |
Source: Public Records
Map
Nearby Homes
- 0 Undetermined Unit MFRO6344063
- 0 Undetermined Unit A11874879
- 0 Undetermined Unit MFRO6338422
- 0 Undetermined Unit MFRO6338413
- 0 Undetermined Unit F10469957
- 15226 SW 43rd Avenue Rd
- 15261 SW 43rd Avenue Rd
- 443 Marion Oaks Course
- 442 Marion Oaks Course
- 4406 SW 152nd St
- 4411 SW 152nd St
- 16446 SW 47th Ct
- 0 SW 153 Place Rd Unit MFROM711656
- 0 SW 143 Lane Rd Unit MFROM711659
- 0 SW 43 Cir Unit MFROM711176
- TBD SW 46th Ct
- TBD SW 29th Terrace Rd
- TBD SW 129th Place
- TBD SW 128th St
- 0 SW 89 Cir Unit MFROM699087
- 0 Undetermined Unit A10504171
- BLK 589 LO SW 177 Lane Rd
- 12826 SW 86 Cir
- 00 SW 61 St Cir Unit 9
- 485 Blk 9 Lot
- 139 SW 47th Cir
- 0 SW 8 Ave Unit A1933459
- 0 SW 162nd Loop Unit A1681256
- 0 SW Marion Oaks Blvd Unit A1876196
- 1422 Lot 5
- 3191 Sw
- 0 Undetermined Unit 2932574
- 0 Undetermined Unit MFRO6305744
- 0 SW 177th St Unit 2206409
- TBD SW 43rd Court Rd
- TBD SW 34th Terrace Rd
- lot 7 SW 129th
- 0 SW 162nd Loop Unit MFRO6184977
- 0 Undetermined Unit 9 MFRO6178845
- 0 Undetermined Unit MFRO6160823