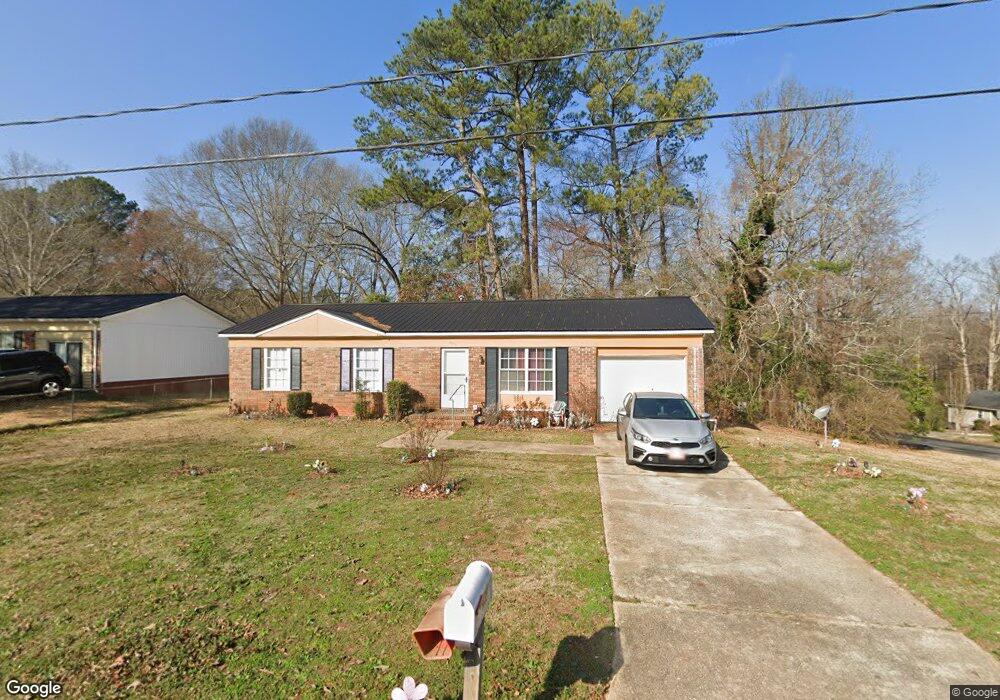
435 Martin Cir Athens, GA 30601
Estimated Value: $120,000 - $198,000
--
Bed
--
Bath
1,000
Sq Ft
$152/Sq Ft
Est. Value
About This Home
This home is located at 435 Martin Cir, Athens, GA 30601 and is currently estimated at $152,346, approximately $152 per square foot. 435 Martin Cir is a home located in Clarke County with nearby schools including Gaines Elementary School, Hilsman Middle School, and Cedar Shoals High School.
Ownership History
Date
Name
Owned For
Owner Type
Purchase Details
Closed on
Jun 12, 2017
Sold by
Todd Michael E
Bought by
Todd Michael E and Todd Christy
Current Estimated Value
Home Financials for this Owner
Home Financials are based on the most recent Mortgage that was taken out on this home.
Original Mortgage
$190,477
Interest Rate
4.05%
Mortgage Type
New Conventional
Purchase Details
Closed on
Apr 25, 2017
Sold by
Mckeel Richard A
Bought by
Todd Michael E
Home Financials for this Owner
Home Financials are based on the most recent Mortgage that was taken out on this home.
Original Mortgage
$190,477
Interest Rate
4.05%
Mortgage Type
New Conventional
Purchase Details
Closed on
Jul 21, 2016
Sold by
Mckeel Richard A
Bought by
Mckeel Richard A
Purchase Details
Closed on
Dec 11, 2008
Sold by
Venable Robert R and Vena Mary H
Bought by
Venable Mary H
Purchase Details
Closed on
Aug 27, 2004
Sold by
Clifton Ivery D and Clifton Patricia D
Bought by
Venable Robert R and Venable Mary H
Create a Home Valuation Report for This Property
The Home Valuation Report is an in-depth analysis detailing your home's value as well as a comparison with similar homes in the area
Home Values in the Area
Average Home Value in this Area
Purchase History
| Date | Buyer | Sale Price | Title Company |
|---|---|---|---|
| Todd Michael E | -- | -- | |
| Todd Michael E | $35,000 | -- | |
| Mckeel Richard A | -- | -- | |
| Venable Mary H | -- | -- | |
| Venable Robert R | $62,000 | -- |
Source: Public Records
Mortgage History
| Date | Status | Borrower | Loan Amount |
|---|---|---|---|
| Closed | Todd Michael E | $190,477 |
Source: Public Records
Tax History Compared to Growth
Tax History
| Year | Tax Paid | Tax Assessment Tax Assessment Total Assessment is a certain percentage of the fair market value that is determined by local assessors to be the total taxable value of land and additions on the property. | Land | Improvement |
|---|---|---|---|---|
| 2024 | $1,295 | $40,323 | $12,000 | $28,323 |
| 2023 | $1,260 | $35,550 | $10,400 | $25,150 |
| 2022 | $918 | $28,785 | $10,400 | $18,385 |
| 2021 | $715 | $21,224 | $7,200 | $14,024 |
| 2020 | $675 | $20,024 | $6,000 | $14,024 |
| 2019 | $543 | $17,062 | $6,000 | $11,062 |
| 2018 | $475 | $15,009 | $6,000 | $9,009 |
| 2017 | $517 | $15,237 | $6,000 | $9,237 |
| 2016 | $492 | $14,486 | $6,000 | $8,486 |
| 2015 | $501 | $14,725 | $6,000 | $8,725 |
| 2014 | $526 | $15,435 | $6,000 | $9,435 |
Source: Public Records
Map
Nearby Homes
- 375 Martin Cir
- 159 Wright Cir
- 125 Martin Ct
- 123 Martin Ct
- 315 Woodridge Cir
- 303 Martin Cir
- 250 Fairview St
- 460 Vine St
- 320 Vine St
- 264 Moreland Ave
- 226 Vine St
- 342 Arch St
- 235 Arch St
- 190 Derby St
- 664 Hancock Industrial Way
- 1480 E Broad St
- 132 N Poplar St
- 1295 E Broad St Unit C1
- 1295 E Broad St Unit C-1