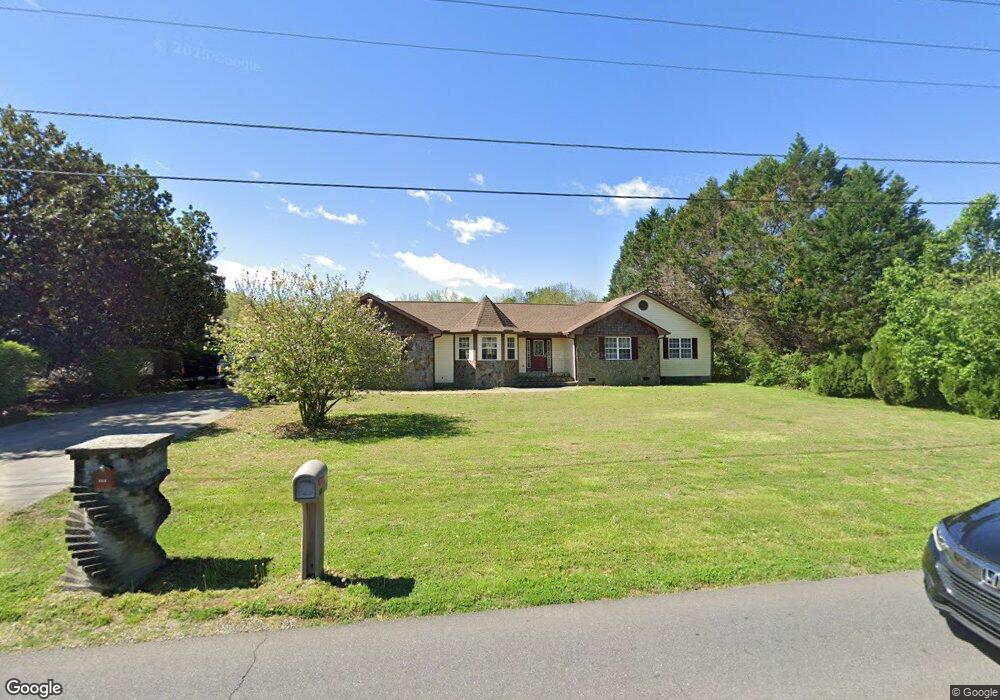
435 McDaniel Station Rd SW Calhoun, GA 30701
Estimated Value: $213,000
3
Beds
2
Baths
1,513
Sq Ft
$141/Sq Ft
Est. Value
About This Home
This home is located at 435 McDaniel Station Rd SW, Calhoun, GA 30701 and is currently priced at $213,000, approximately $140 per square foot. 435 McDaniel Station Rd SW is a home located in Gordon County with nearby schools including Swain Elementary School, Ashworth Middle School, and Gordon Central High School.
Ownership History
Date
Name
Owned For
Owner Type
Purchase Details
Closed on
Jun 10, 2022
Sold by
Nichols Kraig
Bought by
Ward James Henry
Current Estimated Value
Home Financials for this Owner
Home Financials are based on the most recent Mortgage that was taken out on this home.
Original Mortgage
$208,080
Outstanding Balance
$198,040
Interest Rate
5.3%
Mortgage Type
New Conventional
Purchase Details
Closed on
Jun 14, 2013
Sold by
Sexton Barbara
Bought by
Nichols Kraig
Purchase Details
Closed on
Jun 11, 2004
Sold by
Nichols Kraig
Bought by
Nichols Barbara
Purchase Details
Closed on
Dec 5, 2000
Sold by
Gentry Frank
Bought by
Nichols Kraig
Purchase Details
Closed on
Aug 1, 2000
Sold by
Gentry Frank
Bought by
Nichols Kraig
Purchase Details
Closed on
Aug 1, 1999
Sold by
Gentry Frank
Bought by
Gentry Frank
Purchase Details
Closed on
Aug 1, 1998
Bought by
Gentry Frank
Create a Home Valuation Report for This Property
The Home Valuation Report is an in-depth analysis detailing your home's value as well as a comparison with similar homes in the area
Home Values in the Area
Average Home Value in this Area
Purchase History
| Date | Buyer | Sale Price | Title Company |
|---|---|---|---|
| Ward James Henry | $206,000 | -- | |
| Nichols Kraig | -- | -- | |
| Nichols Barbara | $42,500 | -- | |
| Nichols Kraig | -- | -- | |
| Nichols Kraig | $16,600 | -- | |
| Gentry Frank | -- | -- | |
| Gentry Frank | $12,400 | -- |
Source: Public Records
Mortgage History
| Date | Status | Borrower | Loan Amount |
|---|---|---|---|
| Open | Ward James Henry | $208,080 |
Source: Public Records
Tax History Compared to Growth
Tax History
| Year | Tax Paid | Tax Assessment Tax Assessment Total Assessment is a certain percentage of the fair market value that is determined by local assessors to be the total taxable value of land and additions on the property. | Land | Improvement |
|---|---|---|---|---|
| 2021 | $1,720 | $60,040 | $3,360 | $56,680 |
| 2020 | $1,683 | $60,760 | $3,360 | $57,400 |
| 2019 | $1,692 | $60,760 | $3,360 | $57,400 |
| 2018 | $1,424 | $51,440 | $3,360 | $48,080 |
| 2017 | $1,389 | $48,880 | $3,360 | $45,520 |
| 2016 | $1,392 | $48,880 | $3,360 | $45,520 |
| 2015 | $1,310 | $45,680 | $3,360 | $42,320 |
| 2014 | $1,094 | $39,581 | $3,376 | $36,205 |
Source: Public Records
Map
Nearby Homes
- 490 McDaniel Station Rd SW
- 506 McDaniel Station Rd SW
- 458 McDaniel Station Rd SW
- 474 McDaniel Station Rd SW
- 00 Belmont Dr
- 1401 U S 41
- 1311 Us Highway 41
- 261 Liberty Ln SW
- 0 W Belmont Dr Unit 10489910
- 121 Foxhall Dr SW
- 0 Highway 53 Spur SW Unit 7529096
- The Pearson Plan at Creekview
- The Coleman Plan at Creekview
- The Benson II Plan at Creekview
- The Piedmont Plan at Creekview
- The Harrington Plan at Creekview
- The McGinnis Plan at Creekview
- The Caldwell Plan at Creekview
- 402 Linda Ln
- 271 Old Belwood Rd SE
- 425 McDaniel Station Rd SW
- 434 McDaniel Station Rd SW
- 446 McDaniel Station Rd SW
- 385 McDaniel Station Rd SW
- 395 McDaniel Station Rd SW
- 742 McDaniel Station Rd SW
- 155 Techview Dr SW
- 143 Techview Dr SW
- 131 Techview Dr SW
- 141 Thelma Rd SW
- 483 McDaniel Station Rd SW
- 121 Techview Dr SW
- 153 Thelma Rd SW
- 173 Techview Dr SW
- 0 Techview Dr SW
- 134 Thelma Rd SW
- 501 McDaniel Station Rd SW
- 159 Thelma Rd SW
- 146 Techview Dr SW
- 104 Quinton Dr SW