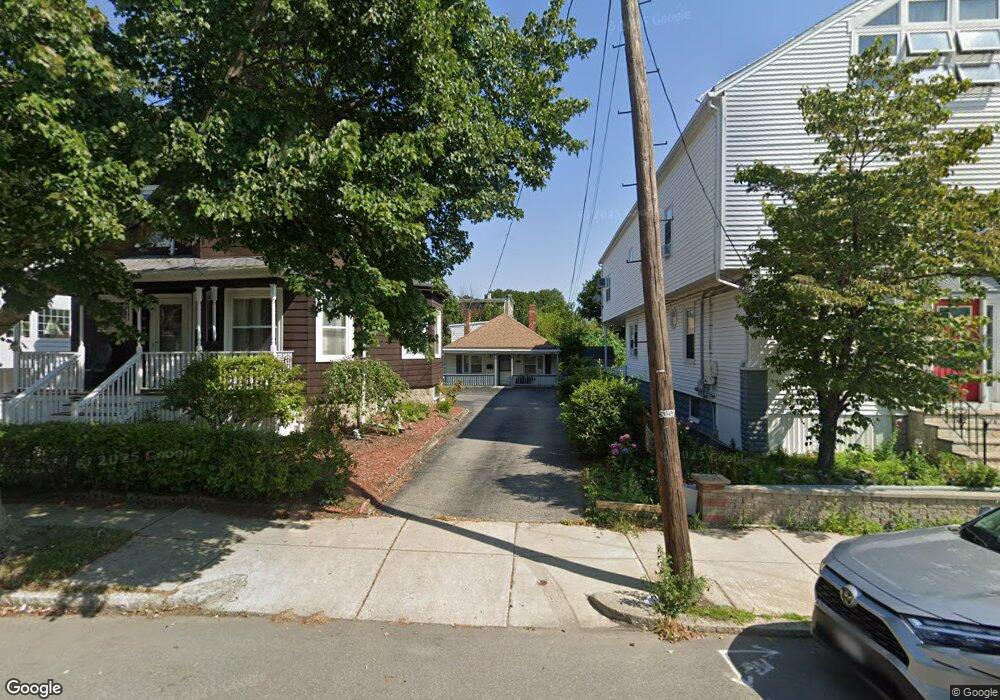
435 Medford St Unit R Malden, MA 02148
Edgeworth NeighborhoodEstimated Value: $554,000 - $678,000
2
Beds
1
Bath
1,420
Sq Ft
$431/Sq Ft
Est. Value
About This Home
This home is located at 435 Medford St Unit R, Malden, MA 02148 and is currently estimated at $612,161, approximately $431 per square foot. 435 Medford St Unit R is a home located in Middlesex County with nearby schools including Malden High School, Mystic Valley Regional Charter School, and Cheverus Catholic School.
Ownership History
Date
Name
Owned For
Owner Type
Purchase Details
Closed on
Aug 17, 2023
Sold by
Zou Hui Q
Bought by
Lin Ft and Zou
Current Estimated Value
Purchase Details
Closed on
Apr 28, 2006
Sold by
Haffner Jonna T and Willis Jonna T
Bought by
Zou Hui Qing and Lin Wei Jiu
Home Financials for this Owner
Home Financials are based on the most recent Mortgage that was taken out on this home.
Original Mortgage
$193,000
Interest Rate
6.4%
Mortgage Type
Purchase Money Mortgage
Purchase Details
Closed on
Nov 4, 1997
Sold by
Mcglinchey Mark
Bought by
Gagnon Lisa A
Home Financials for this Owner
Home Financials are based on the most recent Mortgage that was taken out on this home.
Original Mortgage
$99,900
Interest Rate
7.31%
Mortgage Type
Purchase Money Mortgage
Purchase Details
Closed on
Jun 7, 1993
Sold by
Ridge Joseph T and Ridge Julia W
Bought by
Mcglinchey Mark
Create a Home Valuation Report for This Property
The Home Valuation Report is an in-depth analysis detailing your home's value as well as a comparison with similar homes in the area
Home Values in the Area
Average Home Value in this Area
Purchase History
| Date | Buyer | Sale Price | Title Company |
|---|---|---|---|
| Lin Ft | -- | None Available | |
| Zou Hui Qing | $283,000 | -- | |
| Gagnon Lisa A | $103,000 | -- | |
| Gagnon Lisa A | $103,000 | -- | |
| Mcglinchey Mark | $112,000 | -- |
Source: Public Records
Mortgage History
| Date | Status | Borrower | Loan Amount |
|---|---|---|---|
| Previous Owner | Mcglinchey Mark | $135,000 | |
| Previous Owner | Zou Hui Qing | $193,000 | |
| Previous Owner | Mcglinchey Mark | $137,000 | |
| Previous Owner | Mcglinchey Mark | $99,900 |
Source: Public Records
Tax History Compared to Growth
Tax History
| Year | Tax Paid | Tax Assessment Tax Assessment Total Assessment is a certain percentage of the fair market value that is determined by local assessors to be the total taxable value of land and additions on the property. | Land | Improvement |
|---|---|---|---|---|
| 2025 | $53 | $468,100 | $261,200 | $206,900 |
| 2024 | $5,083 | $434,800 | $246,700 | $188,100 |
| 2023 | $4,850 | $397,900 | $224,900 | $173,000 |
| 2022 | $4,589 | $371,600 | $203,200 | $168,400 |
| 2021 | $4,271 | $347,500 | $181,400 | $166,100 |
| 2020 | $4,279 | $338,300 | $175,200 | $163,100 |
| 2019 | $4,265 | $321,400 | $166,900 | $154,500 |
| 2018 | $4,038 | $286,600 | $137,900 | $148,700 |
| 2017 | $3,769 | $266,000 | $132,400 | $133,600 |
| 2016 | $3,654 | $241,000 | $121,500 | $119,500 |
| 2015 | $3,571 | $227,000 | $115,700 | $111,300 |
| 2014 | $3,355 | $208,400 | $105,200 | $103,200 |
Source: Public Records
Map
Nearby Homes
- 108 Highland Ave
- 74 Highland Ave
- 216 Central Ave Unit 218
- 320 Middlesex Ave Unit A207
- 320 Middlesex Ave Unit E403
- 320 Middlesex Ave Unit A406
- 320 Middlesex Ave Unit A208
- 55 Surrey St
- 55 Evans St
- 149 Pearl St
- 42 Gibson St
- 82 2nd St
- 830 Fellsway
- 38-40 Russell St
- 45 Grant Ave
- 500 Salem St Unit 304
- 500 Salem St Unit 708
- 84 Fellsway E
- 426 Pleasant St Unit 17
- 10 Prospect Terrace
- 435 Medford St
- 433 Medford St
- 439 Medford St
- 441 Medford St
- 441 Medford St Unit 1
- 445 Medford St
- 112 Oakland St
- 120 Oakland St
- 108 Oakland St
- 427 Medford St Unit 429
- 116 Oakland St Unit 118
- 124 Oakland St
- 449 Medford St Unit 451
- 451 Medford St Unit 1
- 449 Medford St Unit 1
- 423 Medford St
- 436 Medford St Unit 438
- 27 Sheridan St
- 442 Medford St Unit 444
- 453 Medford St