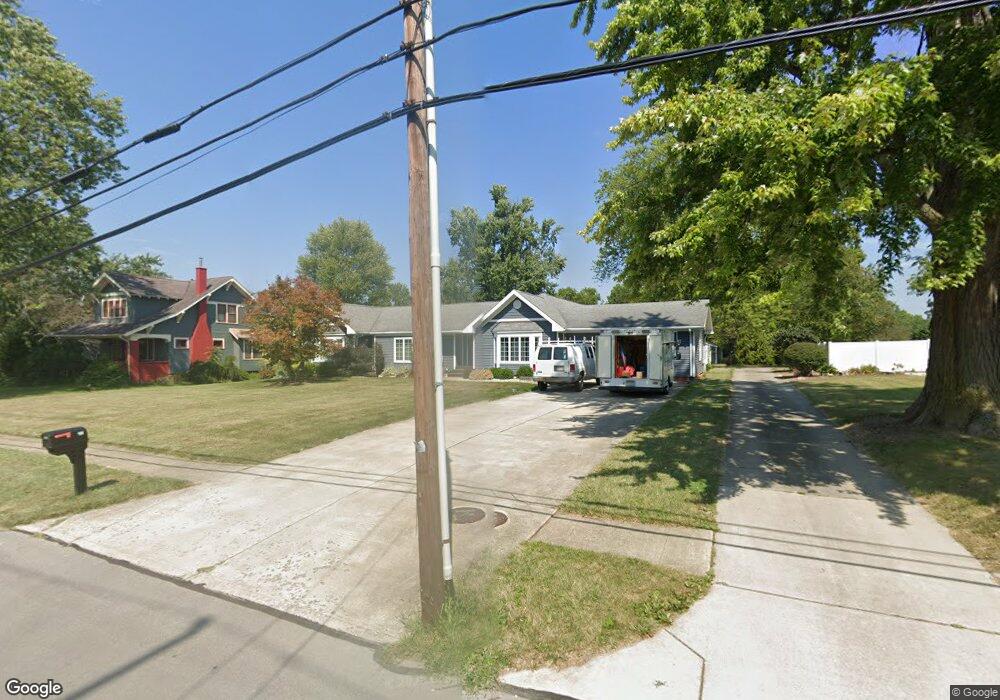
435 Melmore St Tiffin, OH 44883
Estimated Value: $284,000 - $390,000
2
Beds
2
Baths
2,646
Sq Ft
$130/Sq Ft
Est. Value
About This Home
This home is located at 435 Melmore St, Tiffin, OH 44883 and is currently estimated at $345,102, approximately $130 per square foot. 435 Melmore St is a home located in Seneca County with nearby schools including Columbian High School, Bridges Community Academy, and Calvert High School.
Ownership History
Date
Name
Owned For
Owner Type
Purchase Details
Closed on
Feb 26, 2016
Sold by
Gibson Shawn D and Gibson Rita R
Bought by
Chimahusky David and Chimahusky Racquel A
Current Estimated Value
Home Financials for this Owner
Home Financials are based on the most recent Mortgage that was taken out on this home.
Original Mortgage
$216,000
Outstanding Balance
$172,481
Interest Rate
3.92%
Mortgage Type
New Conventional
Estimated Equity
$172,621
Purchase Details
Closed on
May 13, 2002
Sold by
Gaydos Anita M
Bought by
Gibson Shawn D
Create a Home Valuation Report for This Property
The Home Valuation Report is an in-depth analysis detailing your home's value as well as a comparison with similar homes in the area
Home Values in the Area
Average Home Value in this Area
Purchase History
| Date | Buyer | Sale Price | Title Company |
|---|---|---|---|
| Chimahusky David | $240,000 | Assured Title | |
| Gibson Shawn D | $158,000 | -- |
Source: Public Records
Mortgage History
| Date | Status | Borrower | Loan Amount |
|---|---|---|---|
| Open | Chimahusky David | $216,000 |
Source: Public Records
Tax History Compared to Growth
Tax History
| Year | Tax Paid | Tax Assessment Tax Assessment Total Assessment is a certain percentage of the fair market value that is determined by local assessors to be the total taxable value of land and additions on the property. | Land | Improvement |
|---|---|---|---|---|
| 2024 | $3,323 | $98,440 | $13,330 | $85,110 |
| 2023 | $3,326 | $98,440 | $13,330 | $85,110 |
| 2022 | $3,562 | $87,480 | $12,540 | $74,940 |
| 2021 | $3,588 | $87,480 | $12,540 | $74,940 |
| 2020 | $3,656 | $87,486 | $12,544 | $74,942 |
| 2019 | $3,272 | $75,740 | $11,109 | $64,631 |
| 2018 | $3,279 | $75,740 | $11,109 | $64,631 |
| 2017 | $3,018 | $75,740 | $11,109 | $64,631 |
| 2016 | $2,753 | $64,484 | $11,109 | $53,375 |
| 2015 | $2,722 | $64,484 | $11,109 | $53,375 |
| 2014 | $2,508 | $63,098 | $11,109 | $51,989 |
| 2013 | $2,602 | $63,098 | $11,109 | $51,989 |
Source: Public Records
Map
Nearby Homes
- 429 Melmore St
- 445 Melmore St
- 407 Melmore St
- 449 Melmore St
- 24 Westview Ct
- 399 Melmore St
- 438 Melmore St
- 446 Melmore St
- 42 Westview Ct
- 455 Melmore St
- 10 Pinecrest Dr
- 28 Grandview Ct
- 393 Melmore St
- 37 Lincoln Rd
- 25 Lincoln Rd
- 45 Lincoln Rd
- 43 Westview Ct
- 1 Wellington Place
- 15 Lincoln Rd
- 20 Pinecrest Dr