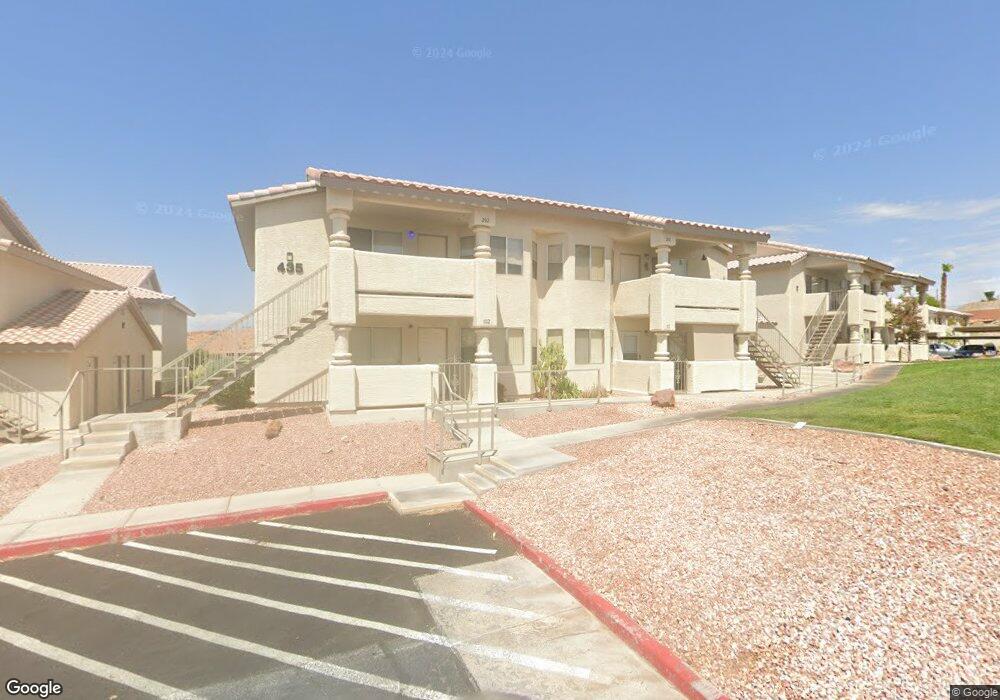
435 Mesa Blvd Unit 201 Mesquite, NV 89027
Estimated Value: $162,000 - $166,000
2
Beds
2
Baths
996
Sq Ft
$164/Sq Ft
Est. Value
About This Home
This home is located at 435 Mesa Blvd Unit 201, Mesquite, NV 89027 and is currently estimated at $163,726, approximately $164 per square foot. 435 Mesa Blvd Unit 201 is a home located in Clark County with nearby schools including Virgin Valley Elementary School, Charles Arthur Hughes Middle School, and Virgin Valley High School.
Ownership History
Date
Name
Owned For
Owner Type
Purchase Details
Closed on
Sep 8, 2025
Sold by
Brown Eric Nelson and Petty-Brown Christine
Bought by
Johnson Michael Bruce and Johnson Jill Magnusson
Current Estimated Value
Home Financials for this Owner
Home Financials are based on the most recent Mortgage that was taken out on this home.
Original Mortgage
$121,875
Outstanding Balance
$121,875
Interest Rate
6.72%
Mortgage Type
New Conventional
Estimated Equity
$41,851
Purchase Details
Closed on
May 5, 2015
Sold by
Hiatt Michael and Kretschmann Monika
Bought by
Brown Eric Nelson and Petty Brown Christine
Home Financials for this Owner
Home Financials are based on the most recent Mortgage that was taken out on this home.
Original Mortgage
$59,600
Interest Rate
3.67%
Mortgage Type
New Conventional
Purchase Details
Closed on
Apr 16, 2010
Sold by
Rowe Walter A and Rowe Edith M
Bought by
Hiatt Michael and Kretschmann Monika
Home Financials for this Owner
Home Financials are based on the most recent Mortgage that was taken out on this home.
Original Mortgage
$54,400
Interest Rate
4.94%
Mortgage Type
New Conventional
Purchase Details
Closed on
Jan 21, 2003
Sold by
Anderson Bruce K and Anderson Peggy Cox
Bought by
Rowe Walter A and Rowe Edith M
Create a Home Valuation Report for This Property
The Home Valuation Report is an in-depth analysis detailing your home's value as well as a comparison with similar homes in the area
Home Values in the Area
Average Home Value in this Area
Purchase History
| Date | Buyer | Sale Price | Title Company |
|---|---|---|---|
| Johnson Michael Bruce | $162,500 | Stewart Title | |
| Brown Eric Nelson | $74,500 | Fidelity National Title | |
| Hiatt Michael | $68,000 | Equity Title Of Nevada | |
| Rowe Walter A | $68,000 | Fidelity National Title |
Source: Public Records
Mortgage History
| Date | Status | Borrower | Loan Amount |
|---|---|---|---|
| Open | Johnson Michael Bruce | $121,875 | |
| Previous Owner | Brown Eric Nelson | $59,600 | |
| Previous Owner | Hiatt Michael | $54,400 |
Source: Public Records
Tax History Compared to Growth
Tax History
| Year | Tax Paid | Tax Assessment Tax Assessment Total Assessment is a certain percentage of the fair market value that is determined by local assessors to be the total taxable value of land and additions on the property. | Land | Improvement |
|---|---|---|---|---|
| 2025 | $682 | $39,265 | $15,050 | $24,215 |
| 2024 | $663 | $39,265 | $15,050 | $24,215 |
| 2023 | $540 | $44,206 | $21,700 | $22,506 |
| 2022 | $644 | $38,173 | $17,325 | $20,848 |
| 2021 | $625 | $33,949 | $13,650 | $20,299 |
| 2020 | $605 | $33,932 | $13,650 | $20,282 |
| 2019 | $587 | $30,705 | $10,500 | $20,205 |
| 2018 | $570 | $25,346 | $5,600 | $19,746 |
| 2017 | $646 | $23,277 | $5,250 | $18,027 |
| 2016 | $540 | $23,994 | $4,550 | $19,444 |
| 2015 | $539 | $18,851 | $3,500 | $15,351 |
| 2014 | $523 | $18,731 | $5,250 | $13,481 |
Source: Public Records
Map
Nearby Homes
- 890 Kitty Hawk Dr Unit 2523
- 714 Appletree Ln
- 704 Appletree Ln
- 931 Monaco Cir
- 726 Mesa Springs Dr
- 601 Hillside Dr
- 744 Pinnacle Ct
- 1074 Chaparral Dr
- 555 Highland Dr Unit 330
- 870 Ironwood Dr
- 1213 Ivy Lee Crest
- 1136 Mohave Dr
- 2453 S Tessaro Ct
- 1222 Blind Pew Ridge
- 1180 Mesa Verde Run
- 465 Turtleback Rd Unit B
- 1309 Vista Del Monte Dr
- 140 Admiral Benbow Way
- 957 Diamond Cir
- 1414 Pomegranate Trail
- 435 Mesa Blvd Unit 101
- 435 Mesa Blvd Unit 202
- 435 Mesa Blvd Unit 102
- 441 Mesa Blvd Unit 102
- 441 Mesa Blvd Unit 201
- 441 Mesa Blvd Unit 202
- 441 Mesa Blvd Unit 101
- 437 Mesa Blvd Unit 101
- 437 Mesa Blvd Unit 201
- 437 Mesa Blvd Unit 102
- 437 Mesa Blvd Unit 202
- 445 Mesa Blvd Unit 101
- 445 Mesa Blvd Unit 201
- 445 Mesa Blvd Unit 102
- 445 Mesa Blvd Unit 202
- 443 Mesa Blvd Unit 102
- 443 Mesa Blvd Unit 201
- 443 Mesa Blvd Unit 101
- 443 Mesa Blvd Unit 202
- 439 Mesa Blvd