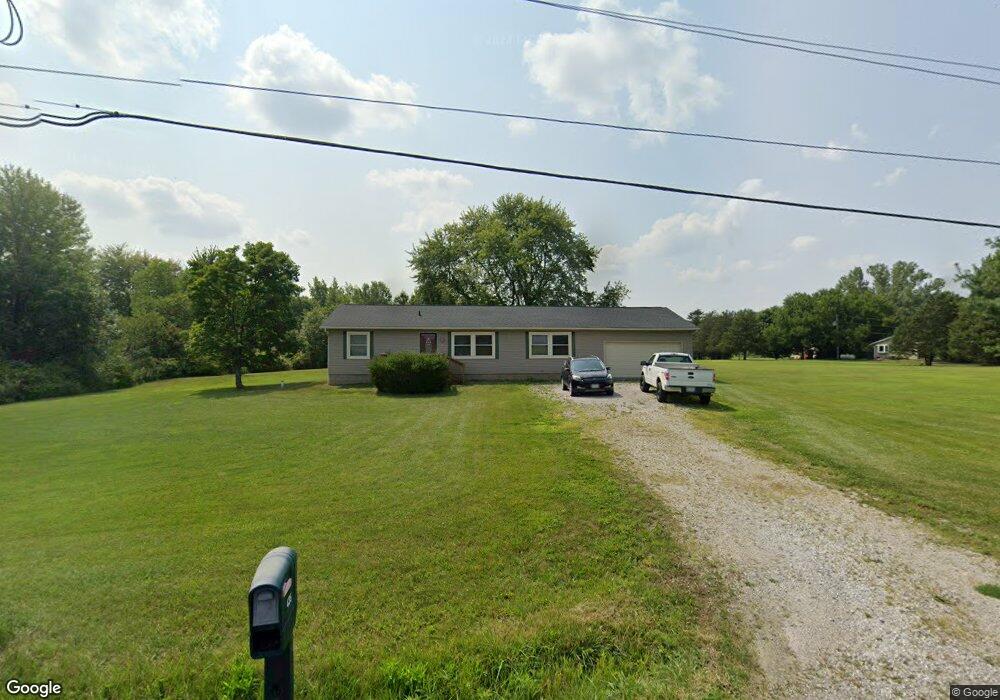
435 N County Line Rd Sunbury, OH 43074
Trenton NeighborhoodEstimated Value: $354,000 - $427,332
3
Beds
2
Baths
1,400
Sq Ft
$286/Sq Ft
Est. Value
About This Home
This home is located at 435 N County Line Rd, Sunbury, OH 43074 and is currently estimated at $399,833, approximately $285 per square foot. 435 N County Line Rd is a home located in Delaware County with nearby schools including Big Walnut Intermediate School, Big Walnut Middle School, and Big Walnut High School.
Ownership History
Date
Name
Owned For
Owner Type
Purchase Details
Closed on
Oct 18, 2000
Sold by
Craftmaster Homes Inc
Bought by
Morrow Jeremy A and Morrow Deana J
Current Estimated Value
Home Financials for this Owner
Home Financials are based on the most recent Mortgage that was taken out on this home.
Original Mortgage
$102,400
Outstanding Balance
$37,451
Interest Rate
7.96%
Mortgage Type
New Conventional
Estimated Equity
$362,382
Purchase Details
Closed on
Feb 3, 2000
Sold by
Bank One
Bought by
Craftmaster Homes Inc
Home Financials for this Owner
Home Financials are based on the most recent Mortgage that was taken out on this home.
Original Mortgage
$101,276
Interest Rate
7.98%
Mortgage Type
New Conventional
Purchase Details
Closed on
Nov 30, 1999
Sold by
Shrf Roberta L Devor Pr
Bought by
Bank One
Create a Home Valuation Report for This Property
The Home Valuation Report is an in-depth analysis detailing your home's value as well as a comparison with similar homes in the area
Home Values in the Area
Average Home Value in this Area
Purchase History
| Date | Buyer | Sale Price | Title Company |
|---|---|---|---|
| Morrow Jeremy A | $128,000 | -- | |
| Craftmaster Homes Inc | $100,000 | -- | |
| Bank One | $76,000 | -- |
Source: Public Records
Mortgage History
| Date | Status | Borrower | Loan Amount |
|---|---|---|---|
| Open | Morrow Jeremy A | $102,400 | |
| Previous Owner | Craftmaster Homes Inc | $101,276 |
Source: Public Records
Tax History Compared to Growth
Tax History
| Year | Tax Paid | Tax Assessment Tax Assessment Total Assessment is a certain percentage of the fair market value that is determined by local assessors to be the total taxable value of land and additions on the property. | Land | Improvement |
|---|---|---|---|---|
| 2024 | $4,236 | $97,370 | $51,940 | $45,430 |
| 2023 | $4,084 | $97,370 | $51,940 | $45,430 |
| 2022 | $3,210 | $65,390 | $34,270 | $31,120 |
| 2021 | $3,195 | $65,390 | $34,270 | $31,120 |
| 2020 | $3,205 | $65,390 | $34,270 | $31,120 |
| 2019 | $2,900 | $57,090 | $25,970 | $31,120 |
| 2018 | $2,739 | $57,090 | $25,970 | $31,120 |
| 2017 | $2,387 | $50,410 | $19,430 | $30,980 |
| 2016 | $2,241 | $50,410 | $19,430 | $30,980 |
| 2015 | $2,218 | $50,410 | $19,430 | $30,980 |
| 2014 | $2,292 | $50,410 | $19,430 | $30,980 |
| 2013 | $2,384 | $48,380 | $19,430 | $28,950 |
Source: Public Records
Map
Nearby Homes
- 545 N County Line Rd
- 16251 E State Route 37
- 9200 Johnstown Alexandria Rd
- The Iris Residence Plan at The Oaks at Big Walnut
- Scarlett Custom Plan A at The Oaks at Big Walnut
- Kline Residence Plan at The Oaks at Big Walnut
- Ferryman Residence Plan at The Oaks at Big Walnut
- Ashford Plan at The Oaks at Big Walnut
- Gia Plan at The Oaks at Big Walnut
- Sawyer Plan at The Oaks at Big Walnut
- Carroll Residence Plan at The Oaks at Big Walnut
- 2019 Parade of Homes | Evans Farm Central Plan at The Oaks at Big Walnut
- 2019 Parade of Homes | Evans Farm Plan at The Oaks at Big Walnut
- 2016 Parade of Homes | Verona Plan at The Oaks at Big Walnut
- Bennett Plan at The Oaks at Big Walnut
- Beckner Residence Plan at The Oaks at Big Walnut
- Zander Residence Plan at The Oaks at Big Walnut
- Georgette Plan at The Oaks at Big Walnut
- Ballinger Residence Plan at The Oaks at Big Walnut
- Erwine Residence Plan at The Oaks at Big Walnut
- 489 N County Line Rd
- 477 N County Line Rd
- 375 N County Line Rd
- 535 N County Line Rd
- 319 N County Line Rd
- 579 N County Line Rd
- 564 N County Line Rd
- 611 N County Line Rd
- 480 N County Line Rd
- 631 N County Line Rd
- 551 N County Line Rd
- 661 N County Line Rd
- 656 N County Line Rd
- 672 N County Line Rd
- 16655 E State Route 37
- 16669 E State Route 37
- 16641 E State Route 37
- 720 N County Line Rd
- 161 N County Line Rd
- 778 N County Line Rd