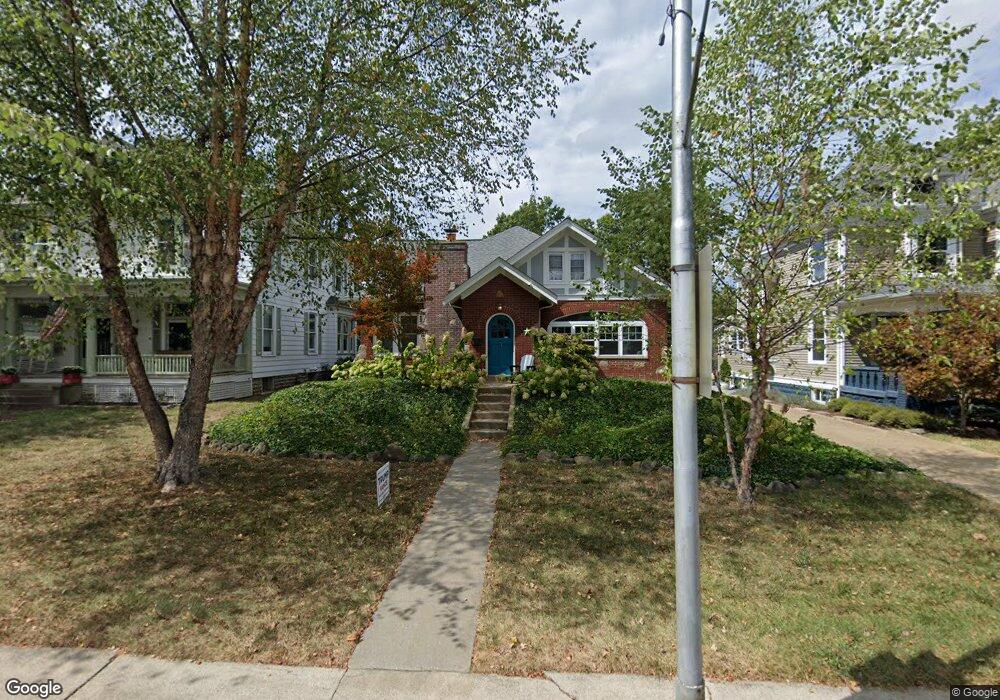
435 N Main St Georgetown, OH 45121
Estimated Value: $187,000 - $272,000
3
Beds
2
Baths
2,001
Sq Ft
$119/Sq Ft
Est. Value
About This Home
This home is located at 435 N Main St, Georgetown, OH 45121 and is currently estimated at $237,263, approximately $118 per square foot. 435 N Main St is a home located in Brown County with nearby schools including Georgetown Elementary School and Georgetown Jr/Sr High School.
Ownership History
Date
Name
Owned For
Owner Type
Purchase Details
Closed on
Dec 14, 2001
Sold by
Shr Buford M Vineyard Pr
Bought by
Linkous Kimberly L Mcelroy
Current Estimated Value
Home Financials for this Owner
Home Financials are based on the most recent Mortgage that was taken out on this home.
Original Mortgage
$80,000
Outstanding Balance
$31,330
Interest Rate
6.6%
Mortgage Type
New Conventional
Estimated Equity
$205,933
Purchase Details
Closed on
Mar 6, 1995
Sold by
Rosell Zachery E
Bought by
Vineyard Buford M and Vineyard Beverly
Home Financials for this Owner
Home Financials are based on the most recent Mortgage that was taken out on this home.
Original Mortgage
$67,320
Interest Rate
9.12%
Mortgage Type
VA
Create a Home Valuation Report for This Property
The Home Valuation Report is an in-depth analysis detailing your home's value as well as a comparison with similar homes in the area
Home Values in the Area
Average Home Value in this Area
Purchase History
| Date | Buyer | Sale Price | Title Company |
|---|---|---|---|
| Linkous Kimberly L Mcelroy | $80,000 | -- | |
| Vineyard Buford M | $66,000 | -- |
Source: Public Records
Mortgage History
| Date | Status | Borrower | Loan Amount |
|---|---|---|---|
| Open | Linkous Kimberly L Mcelroy | $80,000 | |
| Previous Owner | Vineyard Buford M | $67,320 |
Source: Public Records
Tax History Compared to Growth
Tax History
| Year | Tax Paid | Tax Assessment Tax Assessment Total Assessment is a certain percentage of the fair market value that is determined by local assessors to be the total taxable value of land and additions on the property. | Land | Improvement |
|---|---|---|---|---|
| 2024 | $2,372 | $66,850 | $4,630 | $62,220 |
| 2023 | $2,372 | $54,680 | $3,850 | $50,830 |
| 2022 | $2,112 | $54,680 | $3,850 | $50,830 |
| 2021 | $2,093 | $54,680 | $3,850 | $50,830 |
| 2020 | $1,852 | $45,580 | $3,220 | $42,360 |
| 2019 | $1,839 | $45,580 | $3,220 | $42,360 |
| 2018 | $912 | $45,580 | $3,220 | $42,360 |
| 2017 | $1,159 | $34,400 | $3,540 | $30,860 |
| 2016 | $1,159 | $34,400 | $3,540 | $30,860 |
| 2015 | $1,174 | $34,400 | $3,540 | $30,860 |
| 2014 | $1,212 | $34,080 | $3,220 | $30,860 |
| 2013 | $1,208 | $34,080 | $3,220 | $30,860 |
Source: Public Records
Map
Nearby Homes
- 508 Mount Orab Pike
- 405 N Main St
- 403 Elmwood Ct
- 401 Elmwood Ct
- 406 E North St
- 102 Bill Dee Dr
- 331 Spring Grove Dr
- 60 New St
- 104 Elm St
- 427 Kenwood Ave
- 306 W 2nd St
- 874 Mount Orab Pike
- 402 S Pleasant St
- 505 S Water St
- 666 E State St
- 418 Home St
- 708 E State St
- 0 St Rt 221 & Footbridge Unit 1826509
- 25 Douglas Ln
- 155 Free Soil Rd