435 N Maple St Lancaster, OH 43130
Lancaster AreaEstimated Value: $141,000 - $200,000
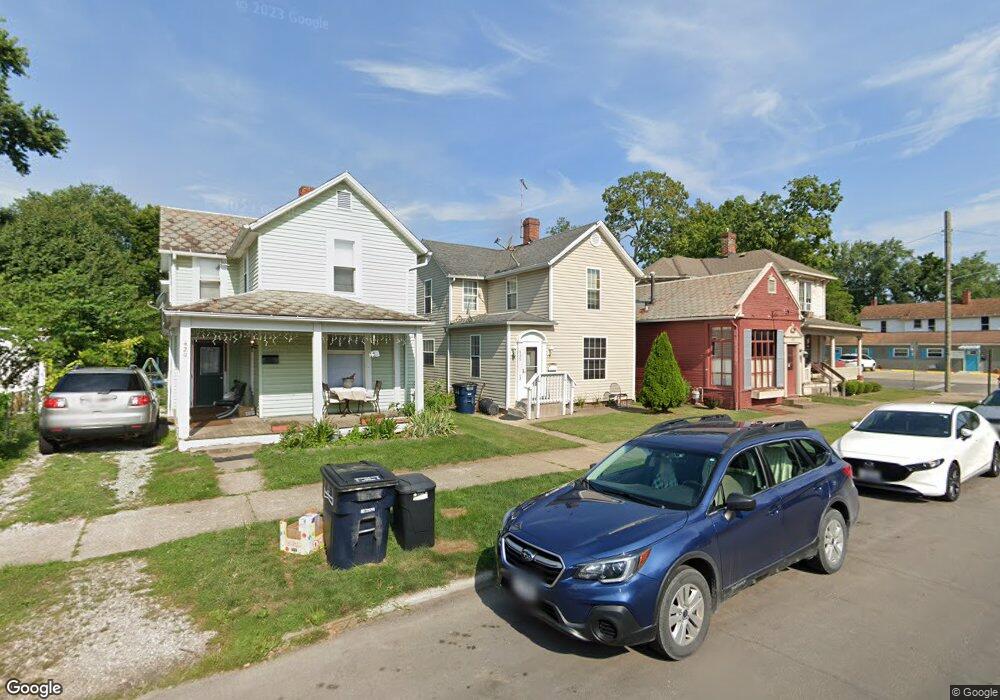
About This Home
This home is located at 435 N Maple St, Lancaster, OH 43130 and is currently estimated at $171,931, approximately $134 per square foot. 435 N Maple St is a home located in Fairfield County with nearby schools including Thomas Ewing Junior High School, Lancaster High School, and St Mary Elementary School.
Ownership History
We collect this data history from publicly available records. To have your information removed, we recommend requesting removal directly through your county’s website.
Purchase Details
Home Financials for this Owner
Home Financials are based on the most recent Mortgage that was taken out on this home.Purchase Details
Home Financials for this Owner
Home Financials are based on the most recent Mortgage that was taken out on this home.Home Values in the Area
Average Home Value in this Area
Purchase History
We collect this data history from publicly available records. To have your information removed, we recommend requesting removal directly through your county’s website.
| Date | Buyer | Sale Price | Title Company |
|---|---|---|---|
| $100,000 | None Available | ||
| $91,000 | Title First Agency Inc |
Mortgage History
We collect this data history from publicly available records. To have your information removed, we recommend requesting removal directly through your county’s website.
| Date | Status | Borrower | Loan Amount |
|---|---|---|---|
| Open | $97,000 | ||
| Previous Owner | $91,000 |
Tax History
We collect this data history from publicly available records. To have your information removed, we recommend requesting removal directly through your county’s website.
| Year | Tax Paid | Tax Assessment Tax Assessment Total Assessment is a certain percentage of the fair market value that is determined by local assessors to be the total taxable value of land and additions on the property. | Land | Improvement |
|---|---|---|---|---|
| 2025 | $3,267 | $53,030 | $11,580 | $41,450 |
| 2024 | $3,267 | $36,340 | $5,580 | $30,760 |
| 2023 | $1,322 | $36,340 | $5,580 | $30,760 |
| 2022 | $1,327 | $36,340 | $5,580 | $30,760 |
| 2021 | $1,130 | $28,980 | $5,580 | $23,400 |
| 2020 | $1,071 | $28,680 | $5,580 | $23,100 |
| 2019 | $1,018 | $28,680 | $5,580 | $23,100 |
| 2018 | $846 | $21,580 | $5,580 | $16,000 |
| 2017 | $846 | $22,590 | $5,370 | $17,220 |
| 2016 | $824 | $22,590 | $5,370 | $17,220 |
| 2015 | $823 | $21,890 | $5,370 | $16,520 |
| 2014 | $784 | $21,890 | $5,370 | $16,520 |
| 2013 | $784 | $21,890 | $5,370 | $16,520 |
Map
- 418 King St
- 617 N Maple St
- 430 W Mulberry St
- 550 E Allen St
- 338 E Mulberry St
- 629 King St
- 430 N High St
- 634 N Mount Pleasant Ave
- 311 E Allen St
- 430 Madison Ave
- 632 Frederick St
- 184 Lake St
- 806 N High St
- 0 W Sixth Ave
- 325 E Chestnut St
- 626 N Broad St
- 639 E Chestnut St
- 142 Lake St
- 628 E Chestnut St
- 154 E Main St
Ask me questions while you tour the home.