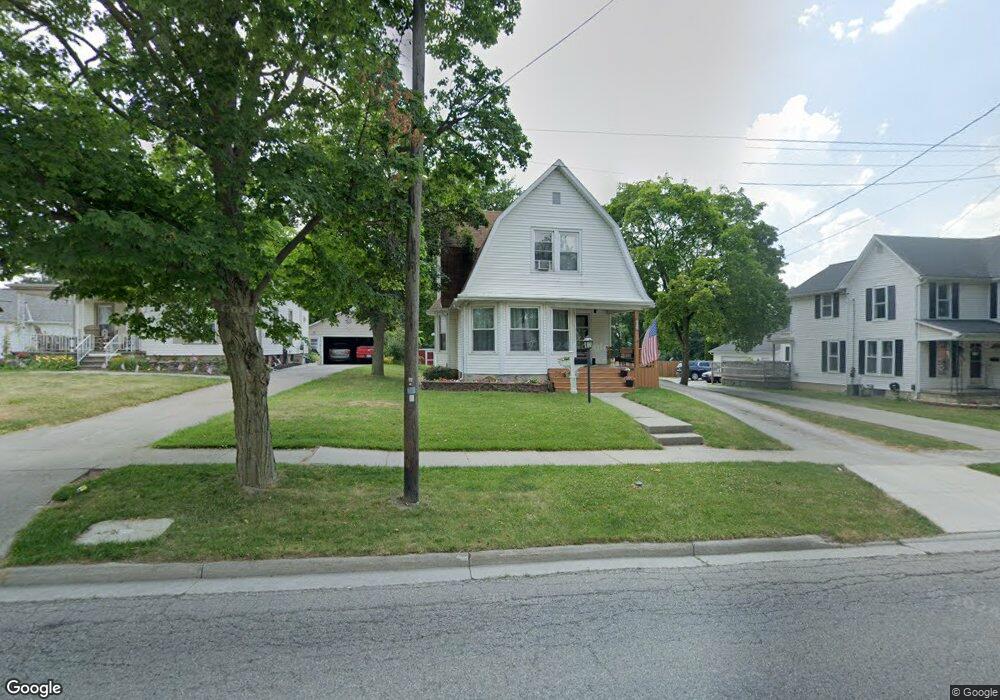
435 N Ottokee St Wauseon, OH 43567
Estimated Value: $148,000 - $174,000
4
Beds
1
Bath
1,715
Sq Ft
$93/Sq Ft
Est. Value
About This Home
This home is located at 435 N Ottokee St, Wauseon, OH 43567 and is currently estimated at $159,768, approximately $93 per square foot. 435 N Ottokee St is a home located in Fulton County with nearby schools including Wauseon Primary School, Wauseon Elementary School, and Wauseon Middle School.
Ownership History
Date
Name
Owned For
Owner Type
Purchase Details
Closed on
Jan 9, 2007
Sold by
Deutsche Bank National Trust Company
Bought by
Thompson Spencer M
Current Estimated Value
Home Financials for this Owner
Home Financials are based on the most recent Mortgage that was taken out on this home.
Original Mortgage
$80,000
Outstanding Balance
$47,755
Interest Rate
6.19%
Mortgage Type
New Conventional
Estimated Equity
$112,013
Purchase Details
Closed on
Jul 10, 2006
Sold by
Schnitkey Kelly J
Bought by
Deutsche Bank National Trust Co and Morgan Stanley Abs Capital I Inc Trust 2
Purchase Details
Closed on
May 8, 1995
Sold by
Pelt Violet A Van
Bought by
Meyer Jordan W and Schnitkey Kelly J
Home Financials for this Owner
Home Financials are based on the most recent Mortgage that was taken out on this home.
Original Mortgage
$64,000
Interest Rate
8.43%
Mortgage Type
New Conventional
Purchase Details
Closed on
Jan 1, 1990
Bought by
Meyer Jordan W
Create a Home Valuation Report for This Property
The Home Valuation Report is an in-depth analysis detailing your home's value as well as a comparison with similar homes in the area
Home Values in the Area
Average Home Value in this Area
Purchase History
| Date | Buyer | Sale Price | Title Company |
|---|---|---|---|
| Thompson Spencer M | $80,000 | Magee Title Agency | |
| Deutsche Bank National Trust Co | $78,667 | None Available | |
| Meyer Jordan W | $66,000 | -- | |
| Meyer Jordan W | -- | -- |
Source: Public Records
Mortgage History
| Date | Status | Borrower | Loan Amount |
|---|---|---|---|
| Open | Thompson Spencer M | $80,000 | |
| Previous Owner | Meyer Jordan W | $64,000 |
Source: Public Records
Tax History
| Year | Tax Paid | Tax Assessment Tax Assessment Total Assessment is a certain percentage of the fair market value that is determined by local assessors to be the total taxable value of land and additions on the property. | Land | Improvement |
|---|---|---|---|---|
| 2024 | $1,965 | $38,290 | $7,280 | $31,010 |
| 2023 | $1,945 | $38,290 | $7,280 | $31,010 |
| 2022 | $1,735 | $29,020 | $6,060 | $22,960 |
| 2021 | $1,846 | $29,020 | $6,060 | $22,960 |
| 2020 | $1,707 | $29,020 | $6,060 | $22,960 |
| 2019 | $1,732 | $29,020 | $6,060 | $22,960 |
| 2018 | $1,524 | $29,020 | $6,060 | $22,960 |
| 2017 | $1,505 | $29,020 | $6,060 | $22,960 |
| 2016 | $1,464 | $25,240 | $6,060 | $19,180 |
| 2015 | $1,374 | $25,240 | $6,060 | $19,180 |
| 2014 | $1,309 | $25,240 | $6,060 | $19,180 |
| 2013 | $1,617 | $28,840 | $5,460 | $23,380 |
Source: Public Records
Map
Nearby Homes
- 203 E Oak St
- 351 E Walnut St
- 252 W Chestnut St
- 833 3rd St
- 263 W Chestnut St
- 594 Douglas Dr
- 420 Clover Ln
- 660 Parkside Dr
- 749 Parkside Dr
- 1338 N Park Ln
- 1066 Seneca Dr
- 1062 Seneca Dr
- 1090 Seneca Dr
- 1171 Apache Dr
- 460 Airport Hwy
- 14578 Us Highway 20a
- 760 Airport Hwy
- 13242 Us Highway 20a
- 14900 County Road H
- 14900 W Co Rd H
- 429 N Ottokee St
- 443 N Ottokee St
- 425 N Ottokee St
- 451 N Ottokee St
- 444 N Ottokee St
- 438 N Ottokee St
- 419 N Ottokee St
- 424 N Ottokee St
- 115 W Walnut St
- 223 Sycamore St
- 422 N Ottokee St
- 413 N Ottokee St
- 220 Jefferson St
- 443 N Fulton St
- 212 Jefferson St
- 420 N Ottokee St
- 445 N Fulton St
- 503 N Ottokee St
- 225 Sycamore St
- 412 N Ottokee St
Your Personal Tour Guide
Ask me questions while you tour the home.