Estimated Value: $783,688 - $990,000
4
Beds
4
Baths
3,302
Sq Ft
$264/Sq Ft
Est. Value
About This Home
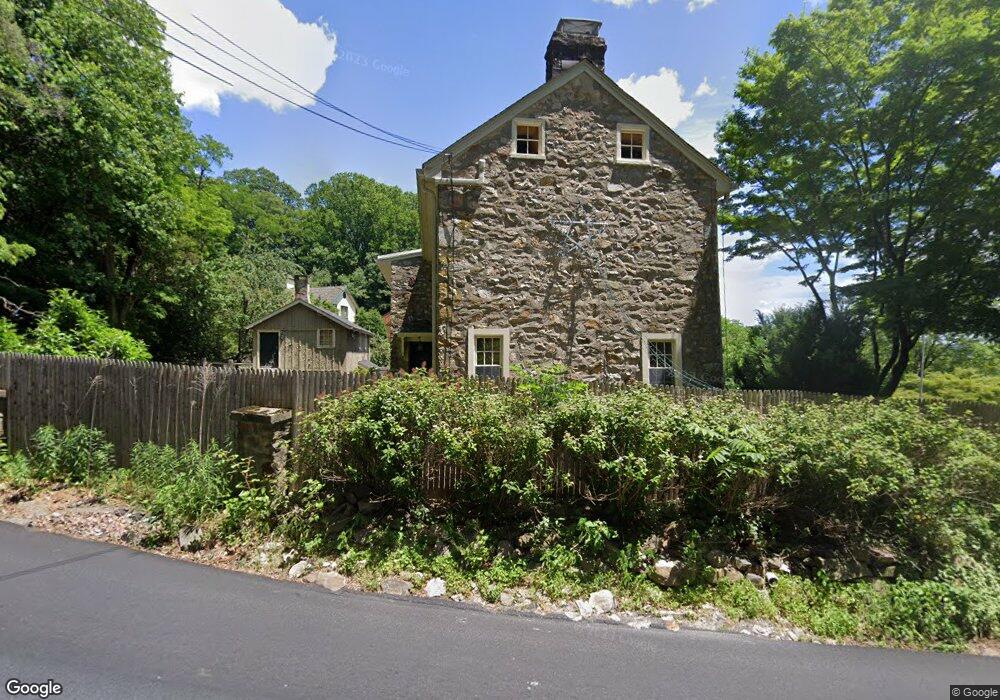
This home is located at 435 N Whitford Rd, Exton, PA 19341 and is currently estimated at $870,172, approximately $263 per square foot. 435 N Whitford Rd is a home located in Chester County with nearby schools including Mary C Howse Elementary School, E.N. Peirce Middle School, and Henderson High School.
Ownership History
Date
Name
Owned For
Owner Type
Purchase Details
Closed on
Feb 22, 2003
Sold by
Jarvis Allan P and Jarvis Martha T
Bought by
Witmer John Robert and Witmer Elizabeth U
Current Estimated Value
Home Financials for this Owner
Home Financials are based on the most recent Mortgage that was taken out on this home.
Original Mortgage
$399,920
Interest Rate
5.93%
Mortgage Type
Purchase Money Mortgage
Purchase Details
Closed on
Jan 12, 1996
Sold by
Palladino Robert J and Palladino Linda A
Bought by
Jarvis Allan P and Jarvis Martha T
Home Financials for this Owner
Home Financials are based on the most recent Mortgage that was taken out on this home.
Original Mortgage
$95,000
Interest Rate
7.16%
Create a Home Valuation Report for This Property
The Home Valuation Report is an in-depth analysis detailing your home's value as well as a comparison with similar homes in the area
Home Values in the Area
Average Home Value in this Area
Purchase History
| Date | Buyer | Sale Price | Title Company |
|---|---|---|---|
| Witmer John Robert | $499,900 | -- | |
| Jarvis Allan P | $280,000 | -- |
Source: Public Records
Mortgage History
| Date | Status | Borrower | Loan Amount |
|---|---|---|---|
| Previous Owner | Witmer John Robert | $399,920 | |
| Previous Owner | Jarvis Allan P | $95,000 |
Source: Public Records
Tax History Compared to Growth
Tax History
| Year | Tax Paid | Tax Assessment Tax Assessment Total Assessment is a certain percentage of the fair market value that is determined by local assessors to be the total taxable value of land and additions on the property. | Land | Improvement |
|---|---|---|---|---|
| 2025 | $7,815 | $274,180 | $39,620 | $234,560 |
| 2024 | $7,815 | $269,600 | $39,620 | $229,980 |
| 2023 | $7,468 | $269,600 | $39,620 | $229,980 |
| 2022 | $7,367 | $269,600 | $39,620 | $229,980 |
| 2021 | $7,260 | $269,600 | $39,620 | $229,980 |
| 2020 | $7,211 | $269,600 | $39,620 | $229,980 |
| 2019 | $7,107 | $269,600 | $39,620 | $229,980 |
| 2018 | $6,948 | $269,600 | $39,620 | $229,980 |
| 2017 | $6,790 | $269,600 | $39,620 | $229,980 |
| 2016 | $5,880 | $269,600 | $39,620 | $229,980 |
| 2015 | $5,880 | $269,600 | $39,620 | $229,980 |
| 2014 | $5,880 | $269,600 | $39,620 | $229,980 |
Source: Public Records
Map
Nearby Homes
- 214 Louis Dr
- 510 Woodview Dr
- 324 Conner Dr
- 491 Orchard Cir
- 312 Green Cir
- 315 Oak Ln W
- 208 Morris Rd
- 420 Oakland Dr
- 534 Pewter Dr
- 109 Glendale Rd
- 577 Pewter Dr
- 17 Buttonwood Dr Unit 17
- 100 Brookhollow Dr
- 464 E Radnor Ct
- 30 S Village Ave
- 701 Worthington Dr Unit 701
- 204 Mill Pond Dr
- Santorini Plan at Worthington Farm - Luxury Single-Family Homes
- Monaco Plan at Worthington Farm - Luxury Single-Family Homes
- Lisbon Plan at Worthington Farm - Luxury Single-Family Homes
- 437 N Whitford Rd
- 349 Wrights Ln
- 345 Wrights Ln
- 439 N Whitford Rd
- 441 N Whitford Rd
- 341 Wrights Ln
- 426 N Whitford Rd
- 305 Whitford Hills Rd
- 404 Longwood Dr
- 303 Whitford Hills Rd
- 487 Heather Hill
- 406 Longwood Dr
- 402 Longwood Dr
- 501 N Whitford Rd
- 342 Wrights Ln
- 350 Wrights Ln
- 301 Whitford Hills Rd
- 407 Edgewood Dr
- 346 Wrights Ln
- 488 Heather Hill