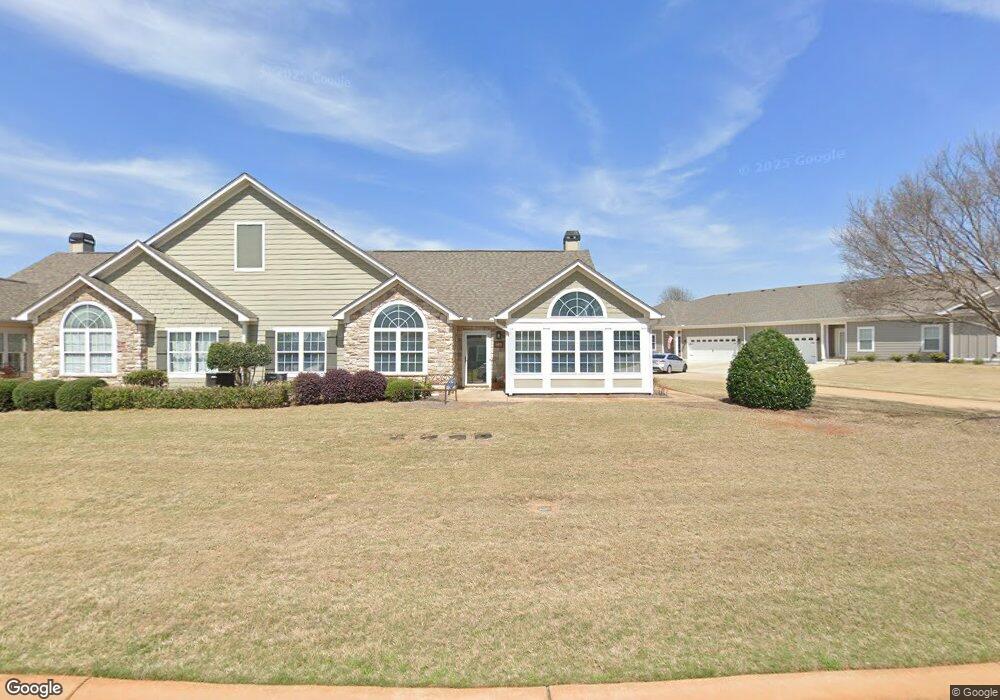
435 Nandina Ct Warner Robins, GA 31088
Estimated Value: $256,717 - $283,000
3
Beds
2
Baths
1,810
Sq Ft
$149/Sq Ft
Est. Value
About This Home
This home is located at 435 Nandina Ct, Warner Robins, GA 31088 and is currently estimated at $270,429, approximately $149 per square foot. 435 Nandina Ct is a home located in Houston County with nearby schools including Lake Joy Primary School, Lake Joy Elementary School, and Feagin Mill Middle School.
Ownership History
Date
Name
Owned For
Owner Type
Purchase Details
Closed on
Nov 10, 2022
Sold by
Nee Brandon Mitchell Prince Supplemental
Bought by
Brandon Mitchell Prince Supplemental Needs Tr
Current Estimated Value
Purchase Details
Closed on
Oct 26, 2022
Sold by
Prince Jan Ethridge
Bought by
Brandon Mitchell Prince Supplemental Needs Tr
Purchase Details
Closed on
Sep 24, 2010
Sold by
Synovus Bank
Bought by
Prince Jan E and Prince Harvey T
Home Financials for this Owner
Home Financials are based on the most recent Mortgage that was taken out on this home.
Original Mortgage
$118,085
Interest Rate
4.44%
Mortgage Type
New Conventional
Purchase Details
Closed on
Jul 22, 2010
Sold by
Corrects 5265 and Corrects 49
Bought by
Synovus Bank
Purchase Details
Closed on
Jul 6, 2010
Sold by
Lakeview Development Partners Llc
Bought by
Synovus Bank
Create a Home Valuation Report for This Property
The Home Valuation Report is an in-depth analysis detailing your home's value as well as a comparison with similar homes in the area
Home Values in the Area
Average Home Value in this Area
Purchase History
| Date | Buyer | Sale Price | Title Company |
|---|---|---|---|
| Brandon Mitchell Prince Supplemental Needs Tr | -- | -- | |
| Brandon Mitchell Prince Supplemental Needs Tr | -- | -- | |
| Prince Jan Ethridge | -- | -- | |
| Prince Jan E | $124,300 | None Available | |
| Synovus Bank | -- | -- | |
| Synovus Bank | -- | -- |
Source: Public Records
Mortgage History
| Date | Status | Borrower | Loan Amount |
|---|---|---|---|
| Previous Owner | Prince Jan E | $118,085 |
Source: Public Records
Tax History Compared to Growth
Tax History
| Year | Tax Paid | Tax Assessment Tax Assessment Total Assessment is a certain percentage of the fair market value that is determined by local assessors to be the total taxable value of land and additions on the property. | Land | Improvement |
|---|---|---|---|---|
| 2024 | $2,703 | $91,320 | $5,000 | $86,320 |
| 2023 | $2,450 | $82,960 | $5,000 | $77,960 |
| 2022 | $1,676 | $74,880 | $5,000 | $69,880 |
| 2021 | $1,526 | $68,000 | $5,000 | $63,000 |
| 2020 | $1,314 | $58,560 | $5,000 | $53,560 |
| 2019 | $1,314 | $58,560 | $5,000 | $53,560 |
| 2018 | $1,314 | $58,560 | $5,000 | $53,560 |
| 2017 | $1,315 | $58,560 | $5,000 | $53,560 |
| 2016 | $1,317 | $58,560 | $5,000 | $53,560 |
| 2015 | -- | $58,560 | $5,000 | $53,560 |
| 2014 | -- | $58,560 | $5,000 | $53,560 |
| 2013 | -- | $50,240 | $5,000 | $45,240 |
Source: Public Records
Map
Nearby Homes
- 439 Nandina Ct
- 437 Nandina Ct
- 441 Nandina Ct
- 515 Nandina Ct
- 460 Nandina Ct
- 122 Sasanqua Dr
- 118 Sasanqua Dr
- 452 Nandina Ct
- 425 Nandina Ct
- 427 Nandina Ct
- 433 Nandina Ct
- 429 Nandina Ct
- 431 Nandina Ct
- 448 Nandina Ct
- 421 Nandina Ct
- 120 Sasanqua Dr
- 419 Nandina Ct
- 128 Sasanqua Dr
- 466 Nandina Ct
- 114 Sasanqua Dr