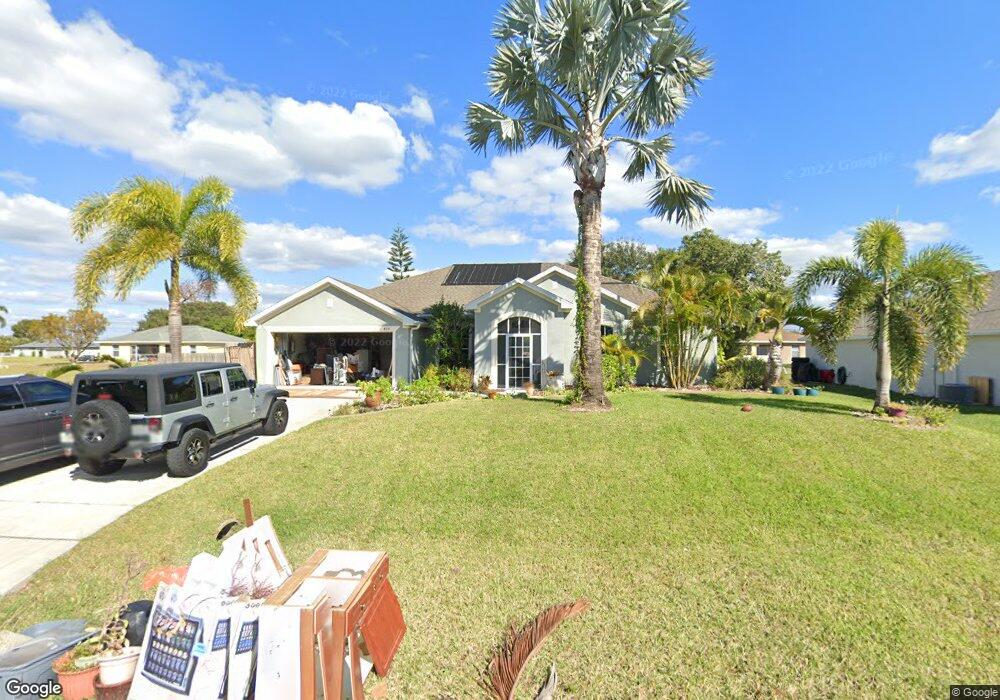
435 NE 1st Place Cape Coral, FL 33909
Mariner NeighborhoodEstimated Value: $425,755 - $527,000
3
Beds
2
Baths
2,807
Sq Ft
$169/Sq Ft
Est. Value
About This Home
This home is located at 435 NE 1st Place, Cape Coral, FL 33909 and is currently estimated at $474,439, approximately $169 per square foot. 435 NE 1st Place is a home located in Lee County with nearby schools including Caloosa Elementary School, Tropic Isles Elementary School, and J. Colin English Elementary School.
Ownership History
Date
Name
Owned For
Owner Type
Purchase Details
Closed on
Nov 24, 2021
Sold by
Repke Dennis and Repke Gayle
Bought by
Mannella Michael and Gafford Kerry
Current Estimated Value
Home Financials for this Owner
Home Financials are based on the most recent Mortgage that was taken out on this home.
Original Mortgage
$394,250
Outstanding Balance
$361,562
Interest Rate
3.05%
Mortgage Type
New Conventional
Estimated Equity
$112,877
Purchase Details
Closed on
Mar 9, 2009
Sold by
Us Bank National Association
Bought by
Repke Dennis and Repke Gayle
Purchase Details
Closed on
Jan 27, 2009
Sold by
Dennis Scott and Dennis Michelle
Bought by
Us Bank National Association
Purchase Details
Closed on
Jun 16, 2006
Sold by
David Weekley Homes Llc
Bought by
Dennis Scott and Dennis Michelle
Home Financials for this Owner
Home Financials are based on the most recent Mortgage that was taken out on this home.
Original Mortgage
$325,000
Interest Rate
8.62%
Mortgage Type
Purchase Money Mortgage
Purchase Details
Closed on
Oct 14, 2003
Sold by
Clark Brodt Gail
Bought by
Shoreland Holdings L L C
Create a Home Valuation Report for This Property
The Home Valuation Report is an in-depth analysis detailing your home's value as well as a comparison with similar homes in the area
Home Values in the Area
Average Home Value in this Area
Purchase History
| Date | Buyer | Sale Price | Title Company |
|---|---|---|---|
| Mannella Michael | $415,000 | Townsend Title Ins Agcy Llc | |
| Repke Dennis | $108,900 | New House Title Llc | |
| Us Bank National Association | -- | Attorney | |
| Dennis Scott | $325,000 | Town Square Title Company | |
| Shoreland Holdings L L C | $6,500 | -- |
Source: Public Records
Mortgage History
| Date | Status | Borrower | Loan Amount |
|---|---|---|---|
| Open | Mannella Michael | $394,250 | |
| Previous Owner | Dennis Scott | $325,000 |
Source: Public Records
Tax History Compared to Growth
Tax History
| Year | Tax Paid | Tax Assessment Tax Assessment Total Assessment is a certain percentage of the fair market value that is determined by local assessors to be the total taxable value of land and additions on the property. | Land | Improvement |
|---|---|---|---|---|
| 2025 | $6,475 | $406,707 | -- | -- |
| 2024 | $6,483 | $395,245 | $43,308 | $303,263 |
| 2023 | $6,483 | $395,334 | $0 | $0 |
| 2022 | $6,147 | $383,817 | $27,816 | $356,001 |
| 2021 | $1,549 | $261,217 | $13,257 | $247,960 |
| 2020 | $1,523 | $123,121 | $0 | $0 |
| 2019 | $1,461 | $120,353 | $0 | $0 |
| 2018 | $1,430 | $118,109 | $0 | $0 |
| 2017 | $1,405 | $115,680 | $0 | $0 |
| 2016 | $1,338 | $209,137 | $8,785 | $200,352 |
| 2015 | $1,318 | $188,584 | $8,091 | $180,493 |
| 2014 | -- | $180,806 | $7,212 | $173,594 |
| 2013 | -- | $157,788 | $5,598 | $152,190 |
Source: Public Records
Map
Nearby Homes
- 142 NE 4th St Unit 35
- 435 NE 1st Ave
- 439 NE Juanita Ct
- 475 NE 2nd Place
- 476 NE 3rd Ave
- 479 NE 2nd Place
- 454 NE Juanita Ct
- 322 NE 4th St
- 1435 NE Juanita Place
- 365 Santa Barbara Blvd N
- 35 NE 5th Terrace
- 458 NE Juanita Ct
- 469 NE Juanita Place
- 29 NE 5th Terrace
- 313 NE 5th Terrace
- 512 NE Juanita Place
- 104 NE 6th St
- 618 NE 2nd Place
- 303 NE 6th St
- 624 NE 2nd Place
- 439 NE 1st Place
- 431 NE 1st Place
- 444 NE 2nd Ave
- 443 NE 1st Place
- 432 NE 1st Place Unit 35
- 432 NE 1st Place
- 436 NE 1st Place
- 448 NE 2nd Ave
- 146 NE 4th St
- 50 NE 4th St
- 138 NE 4th St
- 150 NE 4th St
- 444 NE 1st Place
- 427 NE 1st Ave
- 443 NE 2nd Ave
- 443 NE 2nd Ave Unit 35
- 431 NE 1st Ave
- 447 NE 2nd Ave
- 134 NE 4th St
- 451 NE 1st Place