435 Panther Point Rd Richfield, NC 28137
Estimated Value: $138,197 - $570,000
Studio
1
Bath
745
Sq Ft
$453/Sq Ft
Est. Value
About This Home
This home is located at 435 Panther Point Rd, Richfield, NC 28137 and is currently estimated at $337,799, approximately $453 per square foot. 435 Panther Point Rd is a home located in Rowan County with nearby schools including Morgan Elementary School, Charles C Erwin Middle School, and East Rowan High School.
Create a Home Valuation Report for This Property
The Home Valuation Report is an in-depth analysis detailing your home's value as well as a comparison with similar homes in the area
Tax History
| Year | Tax Paid | Tax Assessment Tax Assessment Total Assessment is a certain percentage of the fair market value that is determined by local assessors to be the total taxable value of land and additions on the property. | Land | Improvement |
|---|---|---|---|---|
| 2025 | $499 | $74,510 | $30,000 | $44,510 |
| 2024 | $499 | $74,510 | $30,000 | $44,510 |
| 2023 | $499 | $74,510 | $30,000 | $44,510 |
| 2022 | $366 | $49,009 | $24,000 | $25,009 |
| 2021 | $366 | $49,009 | $24,000 | $25,009 |
| 2020 | $366 | $49,009 | $24,000 | $25,009 |
| 2019 | $366 | $49,009 | $24,000 | $25,009 |
| 2018 | $325 | $43,908 | $24,000 | $19,908 |
| 2017 | $325 | $43,908 | $24,000 | $19,908 |
| 2016 | $317 | $43,908 | $24,000 | $19,908 |
| 2015 | $354 | $48,276 | $24,000 | $24,276 |
| 2014 | $348 | $49,583 | $24,000 | $25,583 |
Source: Public Records
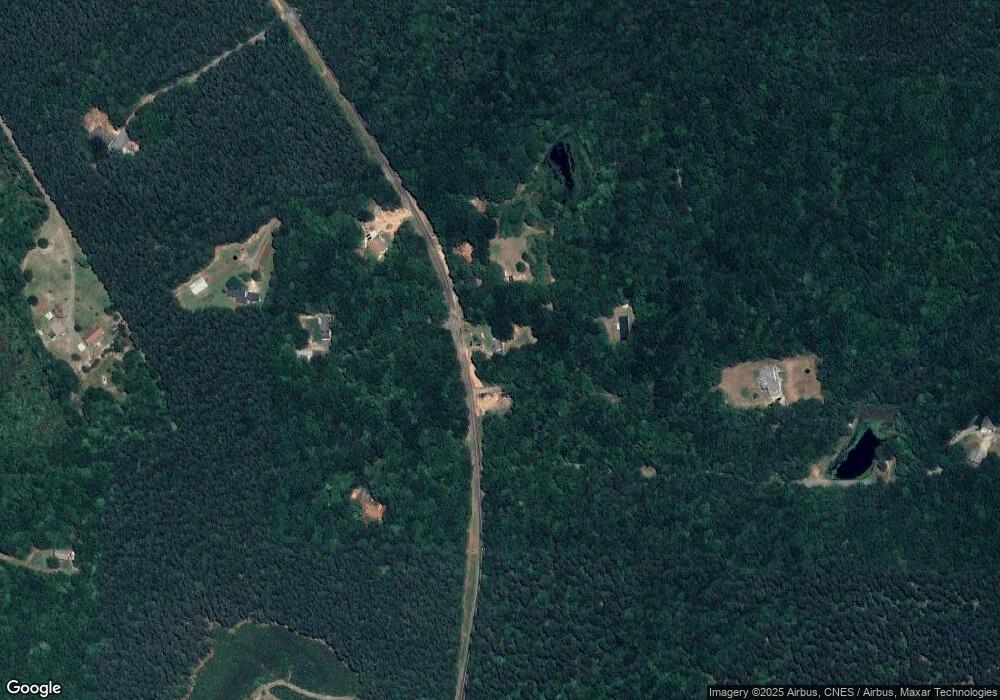
Map
Nearby Homes
- 1026 Emerald Bay Dr
- 1435 Panther Point Rd
- 215 Big Buck Rd
- 174 Mistral Ln
- 151 Sirocco Dr E
- 2288 Rocky Cove Ln
- 174 Sirocco Dr E
- 0 Wyatt Grove Church Rd Unit 1
- 284 Sirocco Dr E
- 430 Sierra Trace Rd
- 530 Sierra Trace Rd
- 00 Panther Creek Rd
- 848 Sierra Trace Rd
- 863 Sierra Trace Rd
- 235 Sailboat Dr
- 0 Playground Ln Unit 1170706
- 0 Playground Ln Unit L25-26 CAR4222360
- 0 Playground Ln Unit 21 CAR4285915
- 0 Playground Ln Unit 22 CAR4285926
- 288 Emerald Isle Ct
- 455 Panther Point Rd
- 460 Panther Point Rd
- 440 Panther Point Rd
- 415 Panther Point Rd
- 639 Panther Point Rd
- 290 Panther Point Trail
- 250 Panther Point Rd
- 11716 Bringle Ferry Rd
- 385 Panther Point Rd
- 2995 Wyatt Grove Church Rd
- 12400 Bringle Ferry Rd
- 180 Panther Point Trail
- 395 Bald Mountain Trail
- 225 Bald Mountain Trail
- 11720 Bringle Ferry Rd
- 1020 Panther Point Rd
- 390 Panther Point Trail
- 11710 Bringle Ferry Rd
- 00 Panther Point Trail
- 245 Panther Point Trail
Your Personal Tour Guide
Ask me questions while you tour the home.