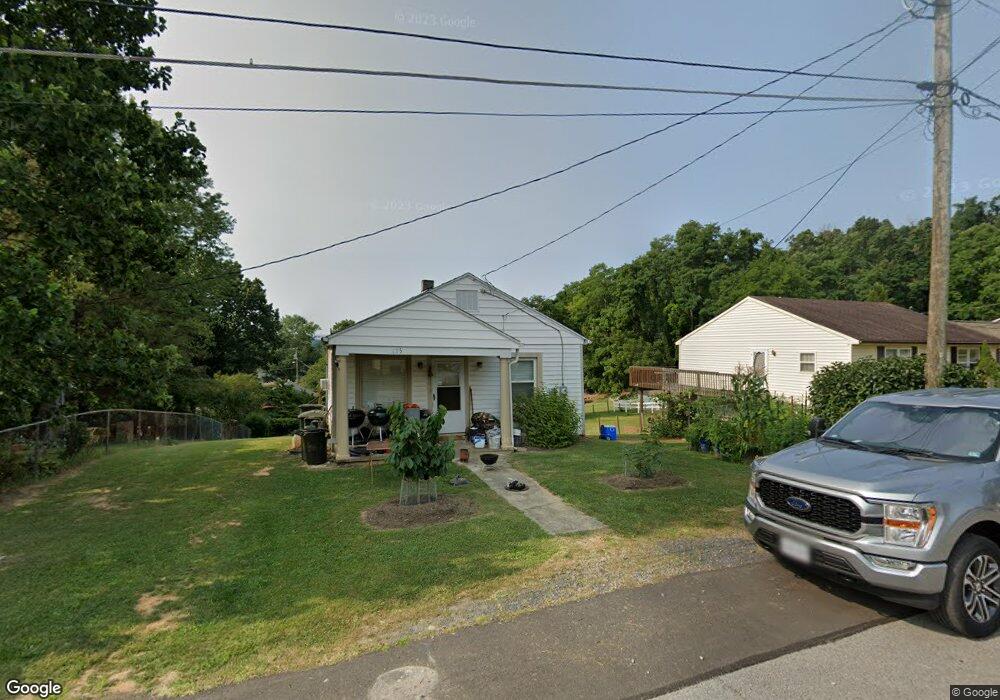
435 Peach St Staunton, VA 24401
Estimated Value: $184,000 - $210,000
2
Beds
1
Bath
759
Sq Ft
$259/Sq Ft
Est. Value
About This Home
This home is located at 435 Peach St, Staunton, VA 24401 and is currently estimated at $196,264, approximately $258 per square foot. 435 Peach St is a home located in Staunton City with nearby schools including Thomas C. McSwain Elementary School, Shelburne Middle School, and Staunton High School.
Ownership History
Date
Name
Owned For
Owner Type
Purchase Details
Closed on
Jun 16, 2016
Sold by
Chandler Frankie W and Chandler Kimberly M
Bought by
Chandler Frankie W
Current Estimated Value
Home Financials for this Owner
Home Financials are based on the most recent Mortgage that was taken out on this home.
Original Mortgage
$85,678
Outstanding Balance
$69,386
Interest Rate
4.12%
Mortgage Type
FHA
Estimated Equity
$126,878
Purchase Details
Closed on
Jul 29, 2008
Sold by
Hanlon Heather L
Bought by
Chandler Frankie W and Chandler Kimberly M
Home Financials for this Owner
Home Financials are based on the most recent Mortgage that was taken out on this home.
Original Mortgage
$2,902
Interest Rate
6.4%
Mortgage Type
Stand Alone Second
Purchase Details
Closed on
Dec 3, 2004
Sold by
Koblick Sherri S and Koblick Keldon P
Bought by
Hanlon Heather L
Home Financials for this Owner
Home Financials are based on the most recent Mortgage that was taken out on this home.
Original Mortgage
$53,625
Interest Rate
5.78%
Mortgage Type
New Conventional
Create a Home Valuation Report for This Property
The Home Valuation Report is an in-depth analysis detailing your home's value as well as a comparison with similar homes in the area
Home Values in the Area
Average Home Value in this Area
Purchase History
| Date | Buyer | Sale Price | Title Company |
|---|---|---|---|
| Chandler Frankie W | -- | Court Square Title Agency | |
| Chandler Frankie W | $96,750 | None Available | |
| Hanlon Heather L | -- | None Available |
Source: Public Records
Mortgage History
| Date | Status | Borrower | Loan Amount |
|---|---|---|---|
| Open | Chandler Frankie W | $85,678 | |
| Closed | Chandler Frankie W | $2,902 | |
| Closed | Chandler Frankie W | $95,254 | |
| Previous Owner | Hanlon Heather L | $53,625 |
Source: Public Records
Tax History Compared to Growth
Tax History
| Year | Tax Paid | Tax Assessment Tax Assessment Total Assessment is a certain percentage of the fair market value that is determined by local assessors to be the total taxable value of land and additions on the property. | Land | Improvement |
|---|---|---|---|---|
| 2025 | $1,219 | $133,980 | $41,380 | $92,600 |
| 2024 | $1,022 | $114,860 | $34,960 | $79,900 |
| 2023 | $1,022 | $114,860 | $34,960 | $79,900 |
| 2022 | $807 | $87,720 | $26,720 | $61,000 |
| 2021 | $807 | $87,720 | $26,720 | $61,000 |
| 2020 | $713 | $75,020 | $26,720 | $48,300 |
| 2019 | $713 | $75,020 | $26,720 | $48,300 |
| 2018 | $682 | $70,320 | $26,720 | $43,600 |
| 2017 | $682 | $70,320 | $26,720 | $43,600 |
| 2016 | $668 | $70,320 | $26,720 | $43,600 |
| 2015 | $668 | $70,320 | $26,720 | $43,600 |
| 2014 | $711 | $74,820 | $26,720 | $48,100 |
Source: Public Records
Map
Nearby Homes
- 328 Elm St
- 434 Peach St
- 426 Peach St
- 1838 Vinson St
- 445 Peach St
- 1807 Orchard Ln
- 118 Boddington Rd
- 623 Bull Run
- 1233 Pinehurst Rd
- 910 Westover Dr
- 706 Cherry Hill Dr
- 0 Spring Hill Rd
- 90 Woodlee Rd
- 1185 Pinehurst Rd
- 1032 Selma Blvd
- 1413 Springhill Rd
- 1775 Shutterlee Mill Rd
- 59,61,61A,63,63 Woodlee Rd
- 3894 Shutterlee Mill Ln
- 5 Trace Dr