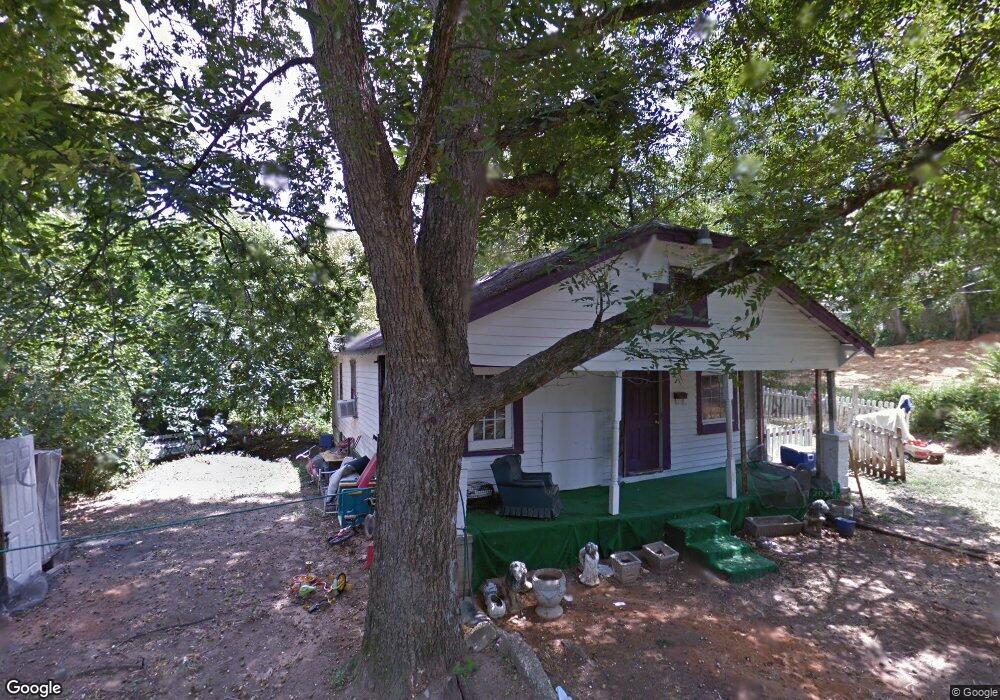
435 Penn Ave Macon, GA 31204
Estimated Value: $51,000 - $133,000
3
Beds
1
Bath
940
Sq Ft
$89/Sq Ft
Est. Value
About This Home
This home is located at 435 Penn Ave, Macon, GA 31204 and is currently estimated at $83,396, approximately $88 per square foot. 435 Penn Ave is a home located in Bibb County with nearby schools including Williams Elementary School, Miller Fine Arts Magnet Middle School, and Central High School.
Ownership History
Date
Name
Owned For
Owner Type
Purchase Details
Closed on
Mar 28, 2023
Sold by
Braabergy Jimell A
Bought by
Oconnor Mary
Current Estimated Value
Purchase Details
Closed on
Jul 21, 2021
Sold by
Bradberry Jimell A
Bought by
Honore Leo M
Purchase Details
Closed on
Aug 23, 2019
Sold by
Wimberly Eleanor
Bought by
Bradberry Jimell A
Purchase Details
Closed on
Aug 4, 2014
Sold by
Adside Wallace
Bought by
Wimberly Eleanor
Purchase Details
Closed on
Feb 2, 2001
Sold by
Security Bank As Succ To Security Nat'L
Bought by
Adside Wallace
Create a Home Valuation Report for This Property
The Home Valuation Report is an in-depth analysis detailing your home's value as well as a comparison with similar homes in the area
Purchase History
| Date | Buyer | Sale Price | Title Company |
|---|---|---|---|
| Oconnor Mary | $5,000 | None Listed On Document | |
| Honore Leo M | -- | None Listed On Document | |
| Honore Leo M | -- | None Listed On Document | |
| Bradberry Jimell A | $5,000 | None Available | |
| Wimberly Eleanor | -- | None Available | |
| Adside Wallace | -- | -- |
Source: Public Records
Tax History
| Year | Tax Paid | Tax Assessment Tax Assessment Total Assessment is a certain percentage of the fair market value that is determined by local assessors to be the total taxable value of land and additions on the property. | Land | Improvement |
|---|---|---|---|---|
| 2025 | $162 | $6,576 | $2,880 | $3,696 |
| 2024 | $153 | $6,022 | $2,400 | $3,622 |
| 2023 | $495 | $5,511 | $2,000 | $3,511 |
| 2022 | $381 | $2,685 | $1,048 | $1,637 |
| 2021 | $102 | $2,685 | $1,048 | $1,637 |
| 2020 | $104 | $2,685 | $1,048 | $1,637 |
| 2019 | $105 | $2,685 | $1,048 | $1,637 |
| 2018 | $341 | $2,685 | $1,048 | $1,637 |
| 2017 | $236 | $6,310 | $1,048 | $5,262 |
| 2016 | $279 | $8,065 | $1,048 | $7,017 |
| 2015 | $395 | $8,065 | $1,048 | $7,017 |
| 2014 | $454 | $8,065 | $1,048 | $7,017 |
Source: Public Records
Map
Nearby Homes
- 395 Lincoln Ave
- 367 Lincoln Ave
- 335 Lincoln Ave
- 320 Lincoln Ave
- 377 Grant Ave
- 313 Forest Ave
- 319 Ruby St
- 2129 Roosevelt Ave
- 2089 Walnut St
- 427 General Winship Dr S
- 433 Pinecrest Rd
- 254 Forest Ave
- 1942 Walnut St
- 251 Ward St
- 2033 Third Ave
- 1963 3rd Ave
- 253 Pursley St
- 290 Moughon St
- 425 Rogers Ave
- 180 Ward St
Your Personal Tour Guide
Ask me questions while you tour the home.